

Consumer Staples Tests Support Level
Consumer Staples Tests Support Level
XLP

Update 9/30/2022
This week ended with XLP closing twice below the $68.25 support level. I take this to confirm the bearish trend in the sector and that we should expect it to continue. Continue reading below to see my original analysis on XLP.

As with most of the market, this recent correction has brought XLP to a critical support level. Before reaching this support level, we saw a gap leading into 9/23. Gaps can mean a lot or nothing, and it is difficult to tell at the moment. I am inclined to believe that this is a measuring gap. Measuring gaps occur about halfway through a price movement. Yesterday saw XLP closing below this level, with an open today above. XLP has found support at the $68.25 level since April last year. Before that, XLP found resistance at the $68.25 level in late 2020. The more tests there are of a support/resistance level, the more important they are. Yesterday’s close below the line was the first time since $68.25 switched from resistance to support. The MACD and RSI are deep into their oversold territory.
Looking at the top 10 holdings of XLP, we see that the Advance/Decline EMA has broken through its upward-sloping support line. This means, on average more of the holdings are decreasing in value. After the rally that ended in April, we see average volume declining on the weekly chart. Declining volume after a bull trend indicates that the trend is over.

Top 3 Holdings by Weight
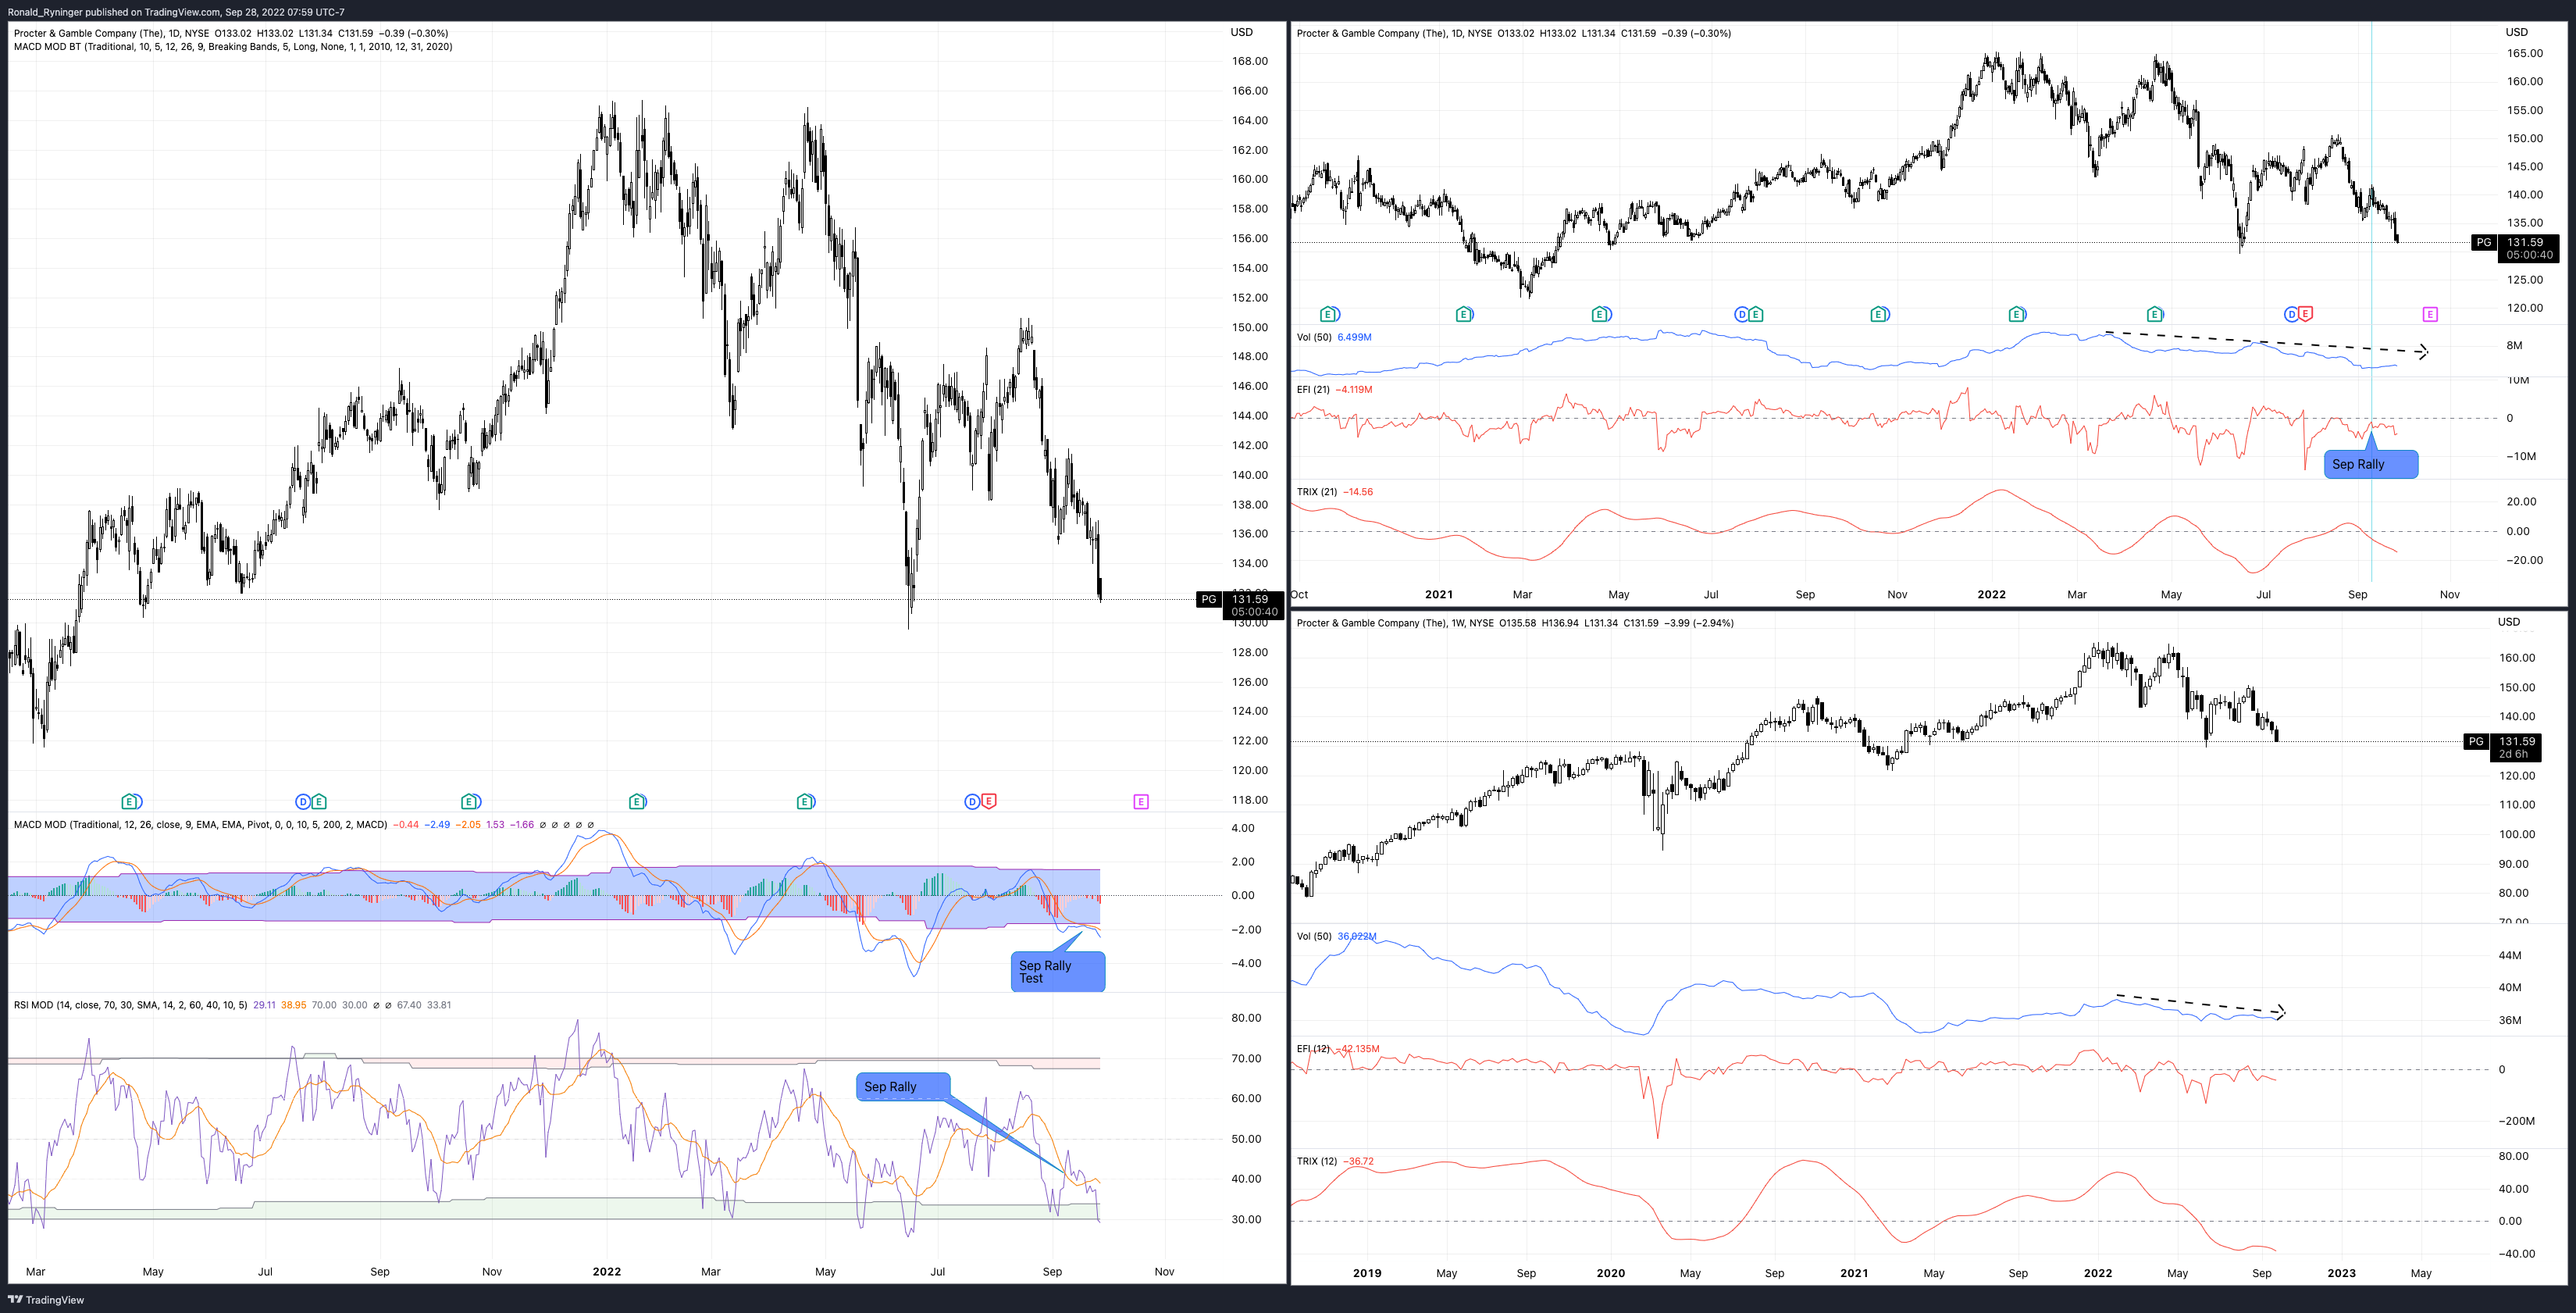
Procter & Gamble (PG)
During the rally in early September, we saw the MACD move to test its oversold boundary and EMA. The MACD provided us a bearish signal by not crossing either. During this rally, we saw the RSI exit its modified oversold zone and cross its SMA. It promptly crossed back under its SMA and reentered the modified oversold territory. Recently the RSI also crossed the traditional oversold line at 30.
Volume has been declining since early this year. It is worth noting that the Force Index remained under 0 on the daily chart during the rally in early September. This is a bearish signal.
PepsiCo, Inc (PEP)
PEP is currently in a correction from what could have been a false upward break of an Ascending Triangle. False breaks out can signal the direction price will eventually break the pattern. More recent price action could also be forming a double bottom. Double bottoms serve as reversal patterns. The MACD is flirting with its oversold boundary, and the RSI is posting higher lows outside its oversold territory. This can be taken as a bullish signal.
Looking at the volume, we see the same decline as in PG and with the Force Index holding below zero. I feel the charts for PEP paint a bullish picture.

The Coca-Cola Company (KO)
Last year ended with KO gapping into the break of its $57.50 resistance level. Today, KO closed that gap, officially returning all of its gains for the year. A close below the gap today would be a strong bearish signal. The MACD and RSI are sitting deep in their oversold territory.
Looking at volume and the Force Index, we see the same decline and remaining under zero as the other two most significant holdings.

Putting it all Together
The sector ETF is at a critical decision point. A subsequent close beneath the support level would further confirm the bearish trend. There is a question about whether the bearish trend will continue with the bullish signals we see in PEP. I believe the bearish trend will continue and take us to around the March ‘21 lows, as indicated by the possible measuring gap.