

Relative Strength Index (RSI)
Relative Strength Index (RSI)
Education

The essence of the RSI is looking at how the current gain or loss compares against the average gain or loss for that period. The calculation is a bit more complicated, and if you want to know the details, I recommend checking it out on Investopedia. The RSI is bounded, meaning all values have to fall between 0 - 100. Being bounded gives us the opportunity to establish Overbought (OB) and Oversold (OS) zones. Traditionally Overbought is an RSI over 70, and Oversold is an RSI under 30.
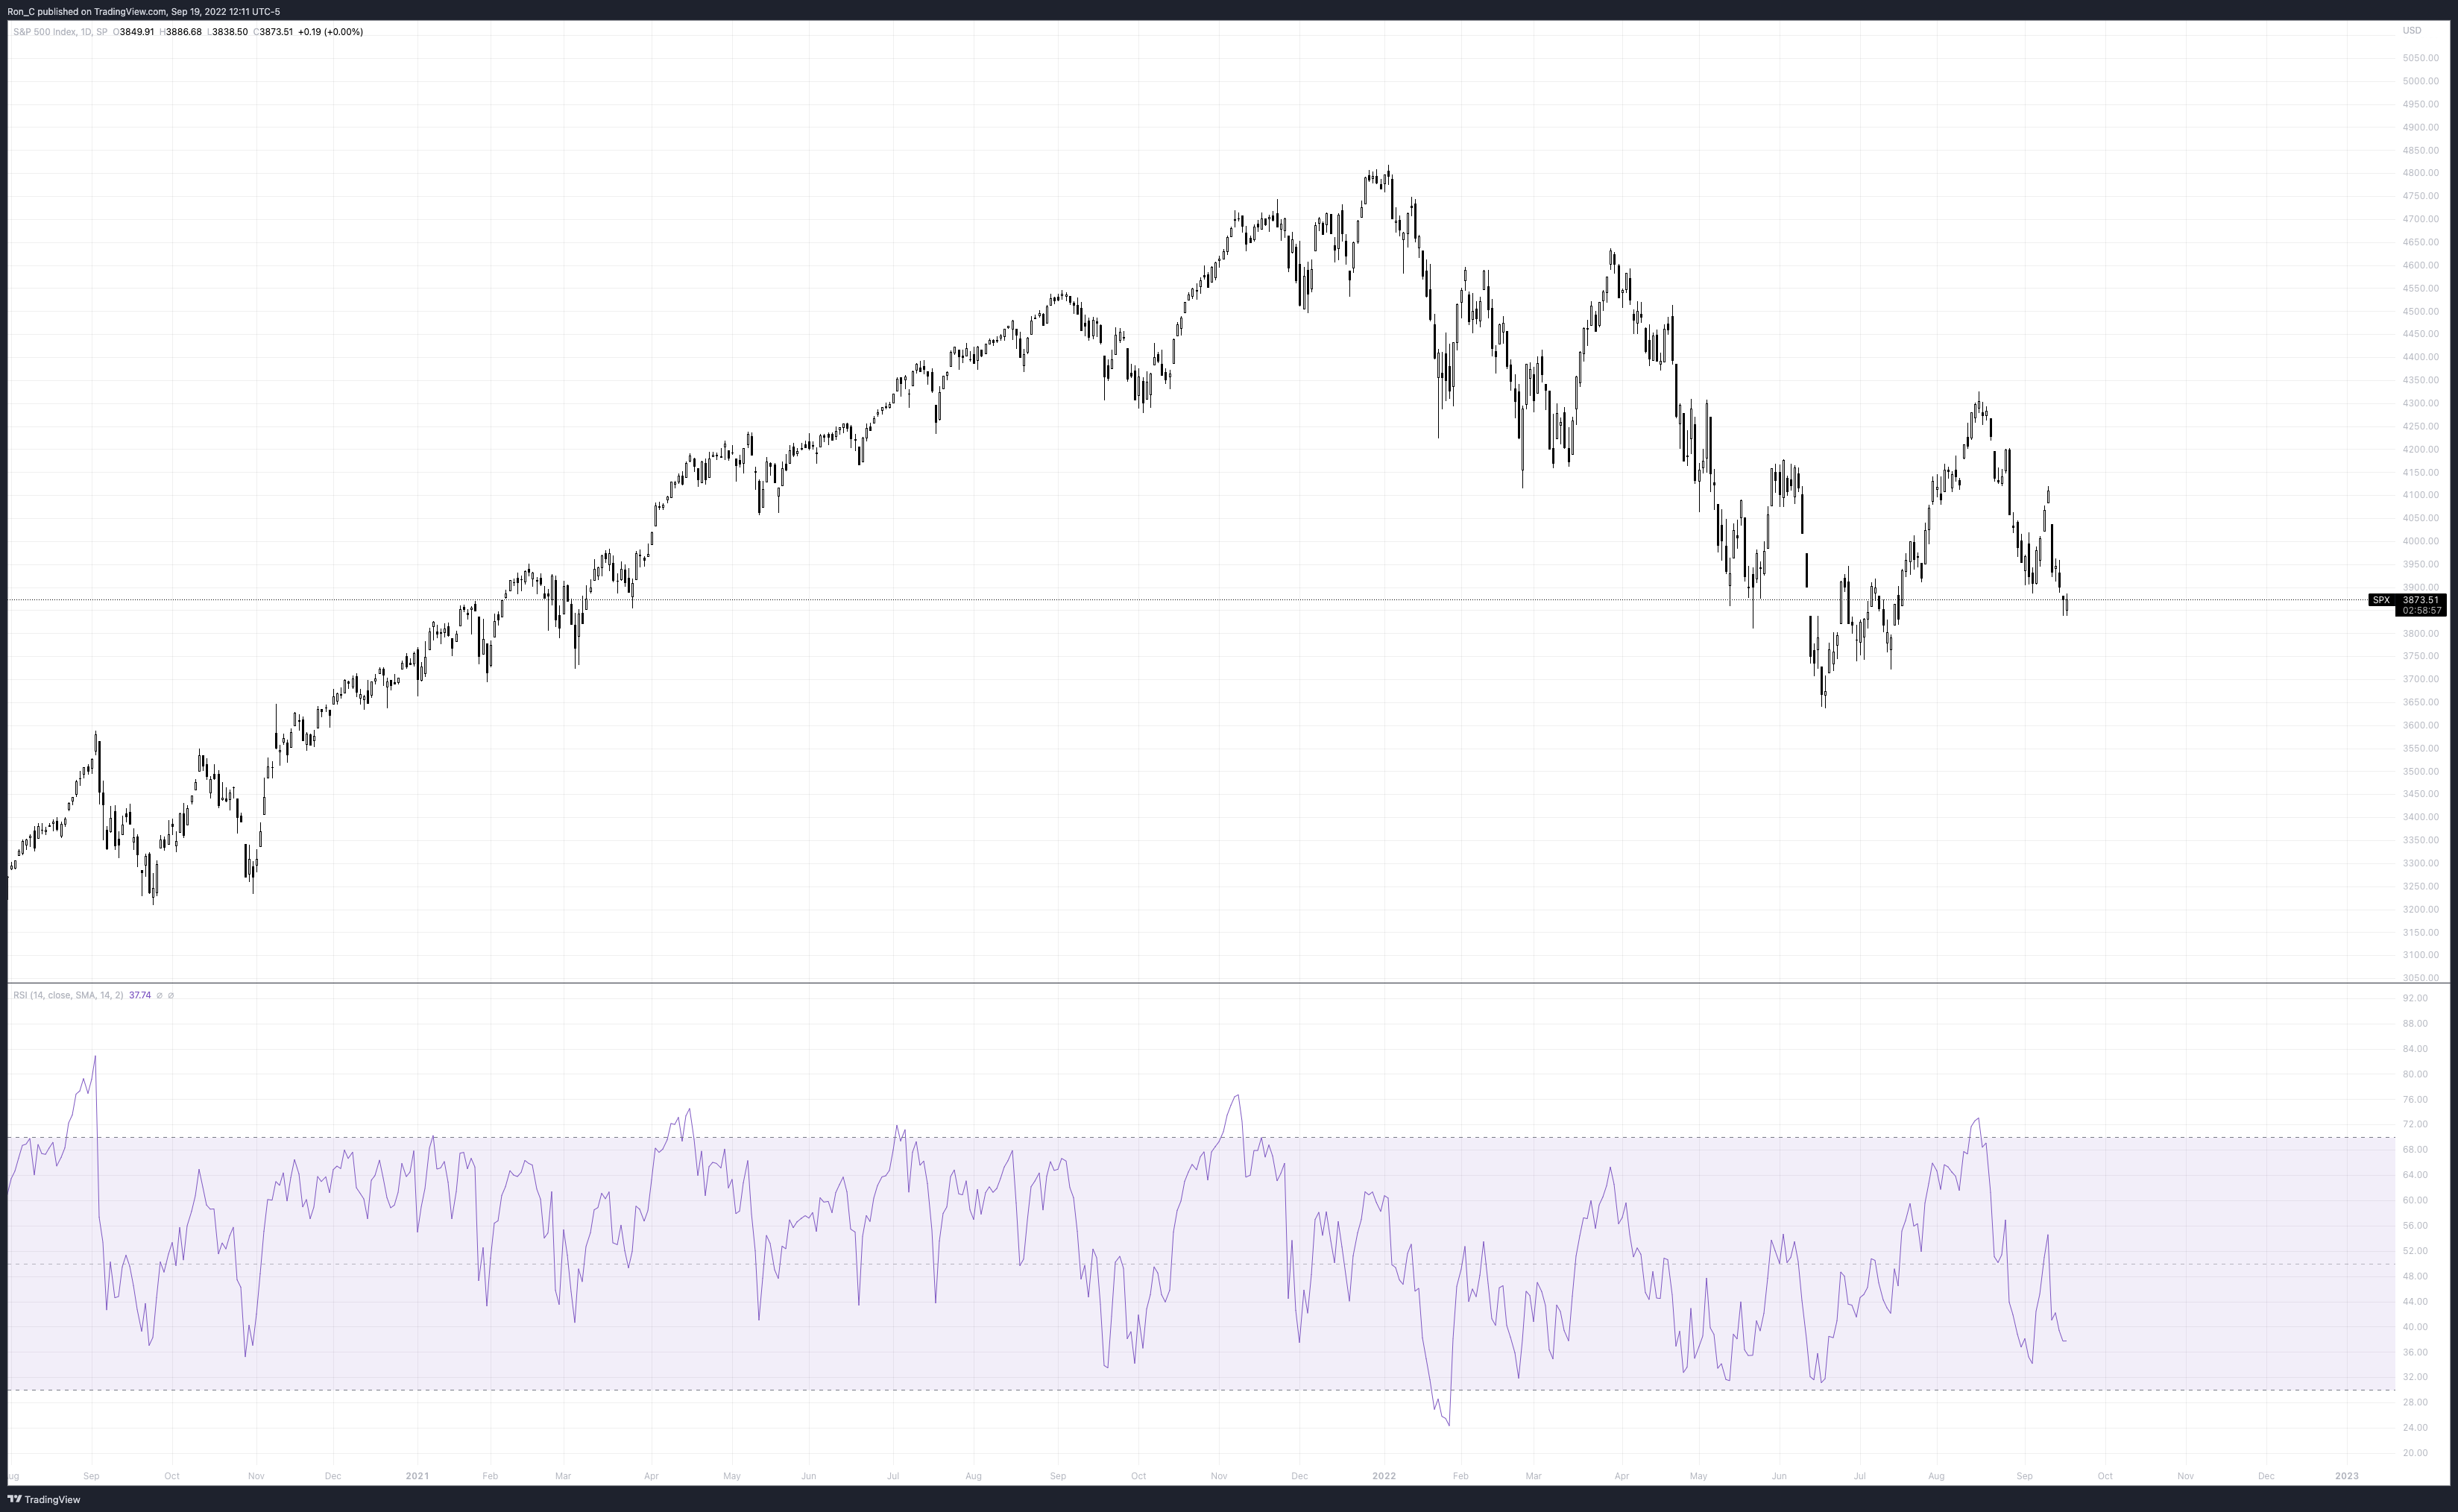
We want this information to understand how the current price action is stacking up against the rest of the calculation period. The OB/OS zones help us gauge what stage a trend is in. Since the oscillator is bounded, we can compare RSI patterns over a longer time period. We can also create support/resistance zones and look for basic chart patterns. Something difficult to do with MACD since it is unbounded. As with the MACD, we can look for divergences in price action and the indicator.
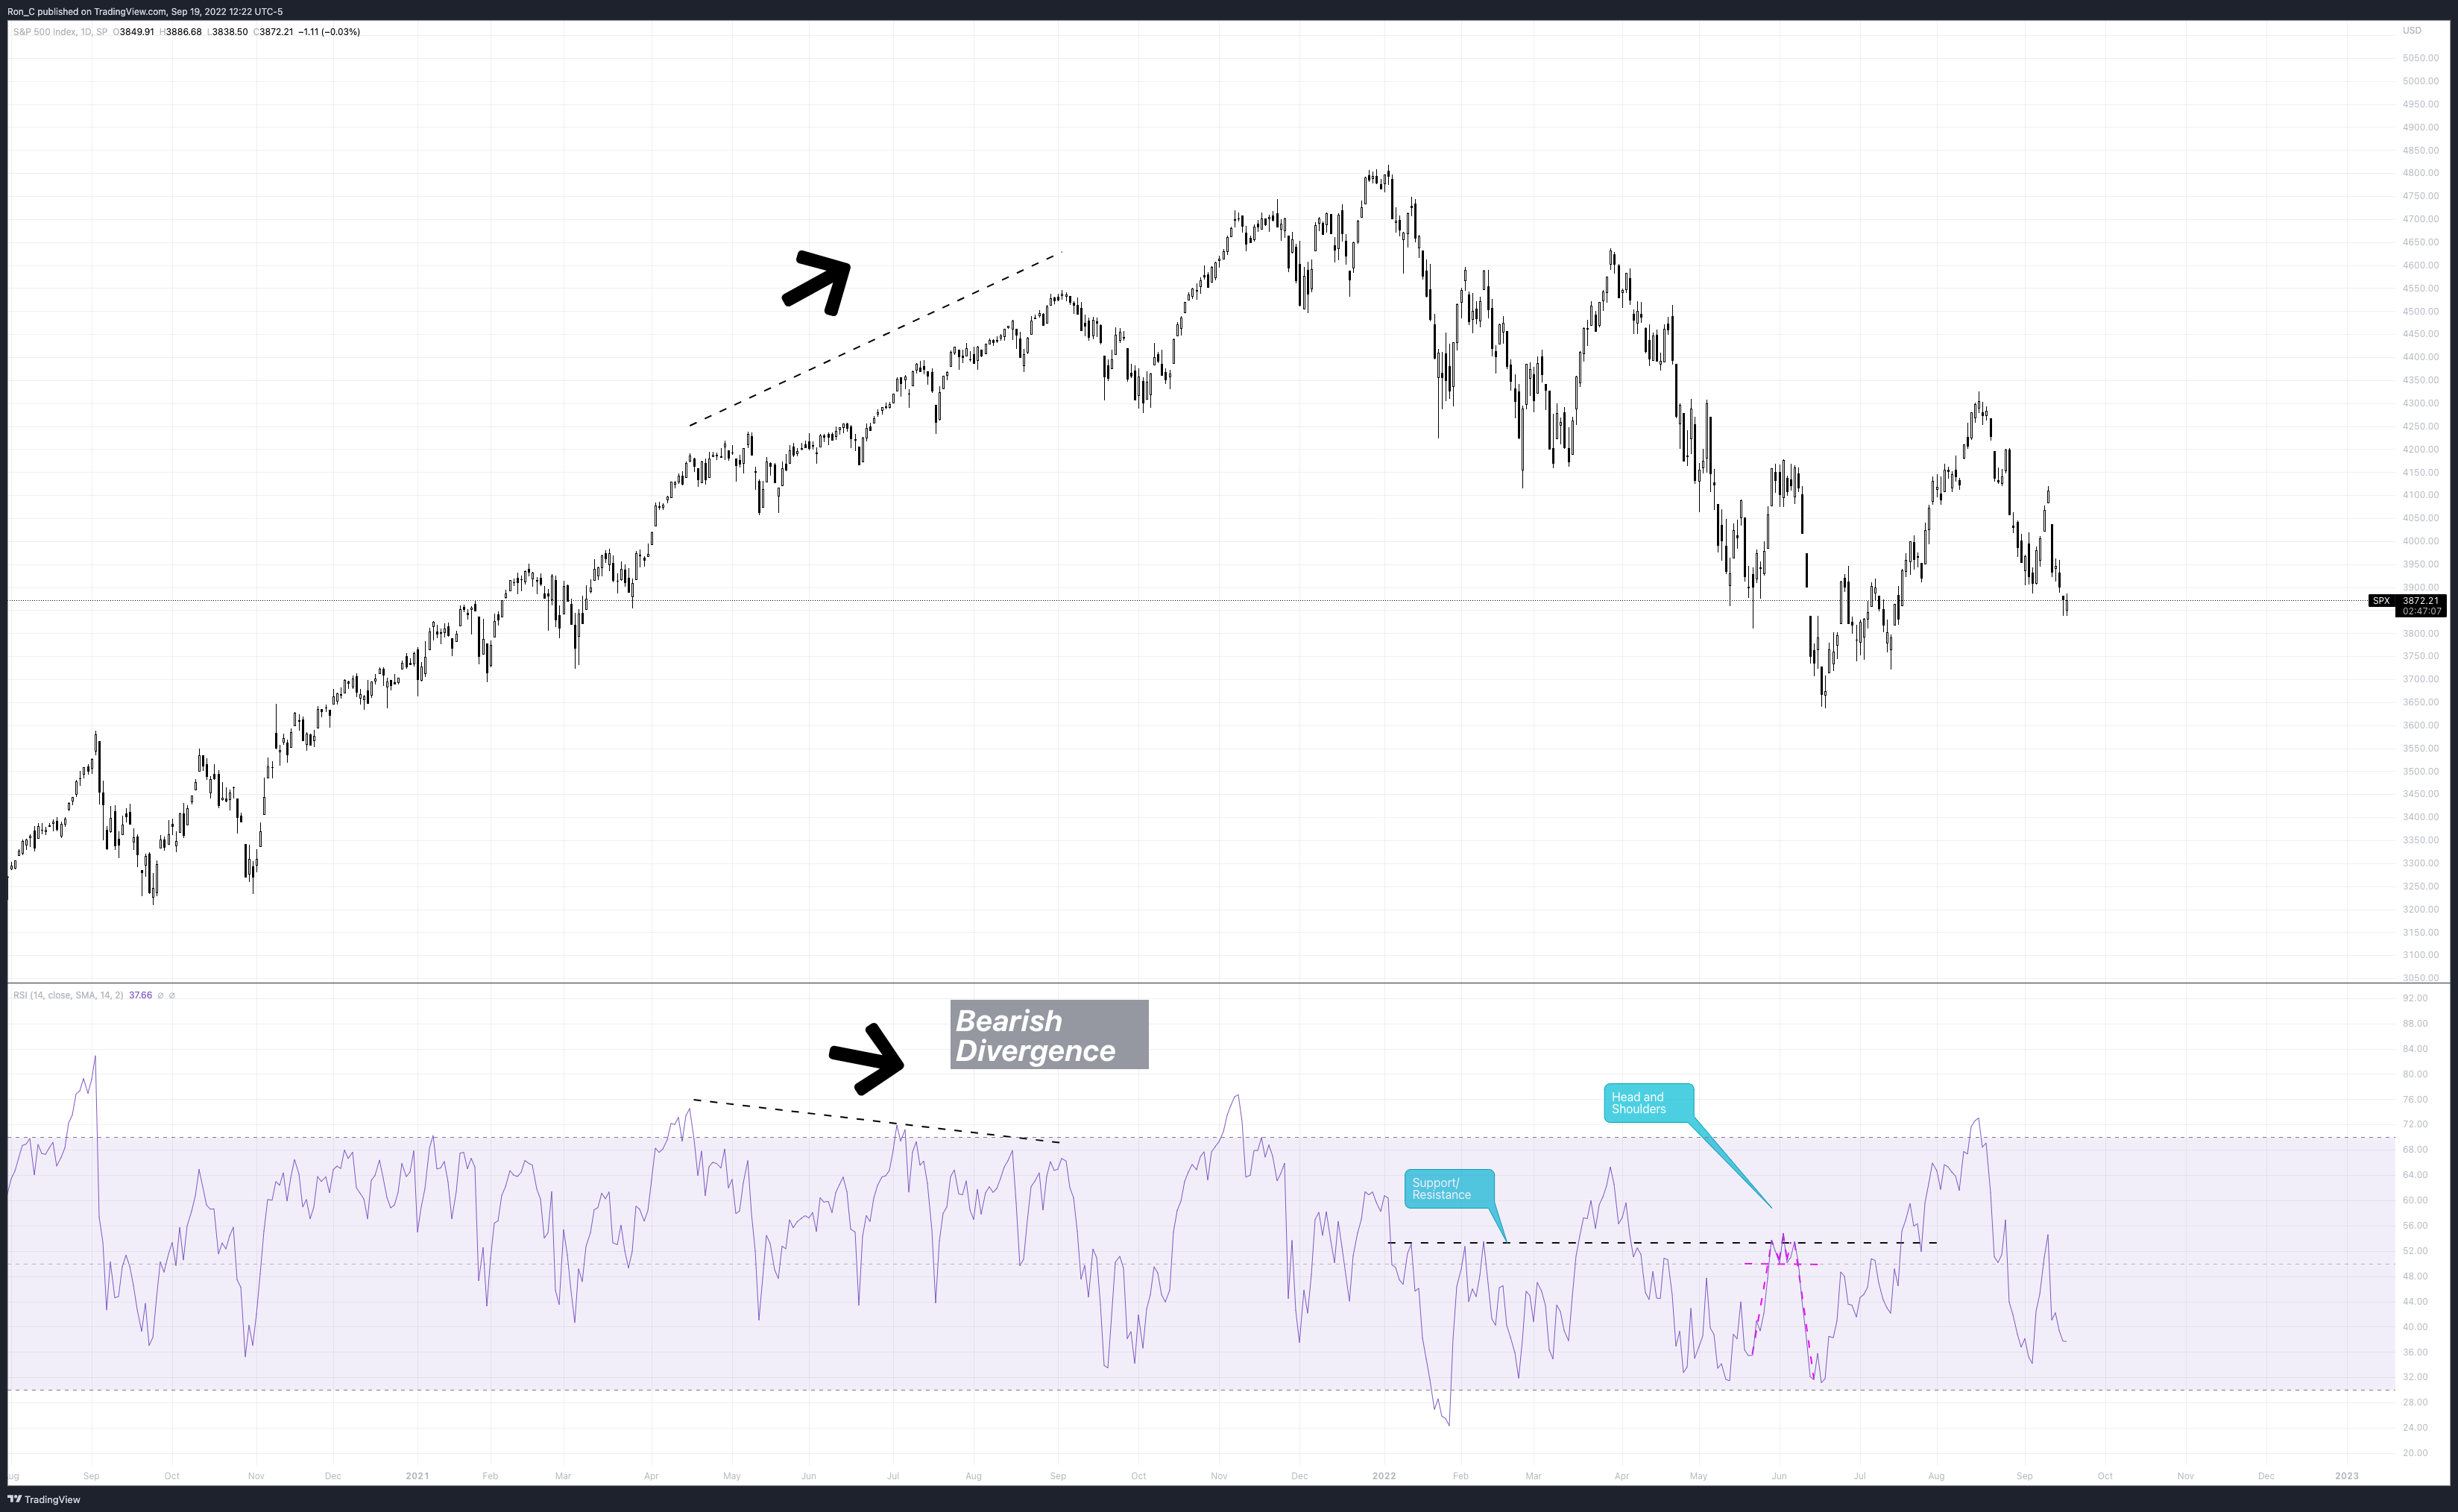
When looking at the daily price action of the SP500, we will use the RSI and MACD as our primary lenses to understand the price action developing on the chart.