

Quiet pre-Fed Week
Quiet pre-Fed Week

Market Overview
The market was quiet this week. Market close today marks the second inside week in a row. Notable news from the week includes inflation reports being slightly higher than expected and a strike by the United Auto Workers (UAW). However, this news did not seem to shake investor confidence that the Fed will not raise rates at its next meeting.
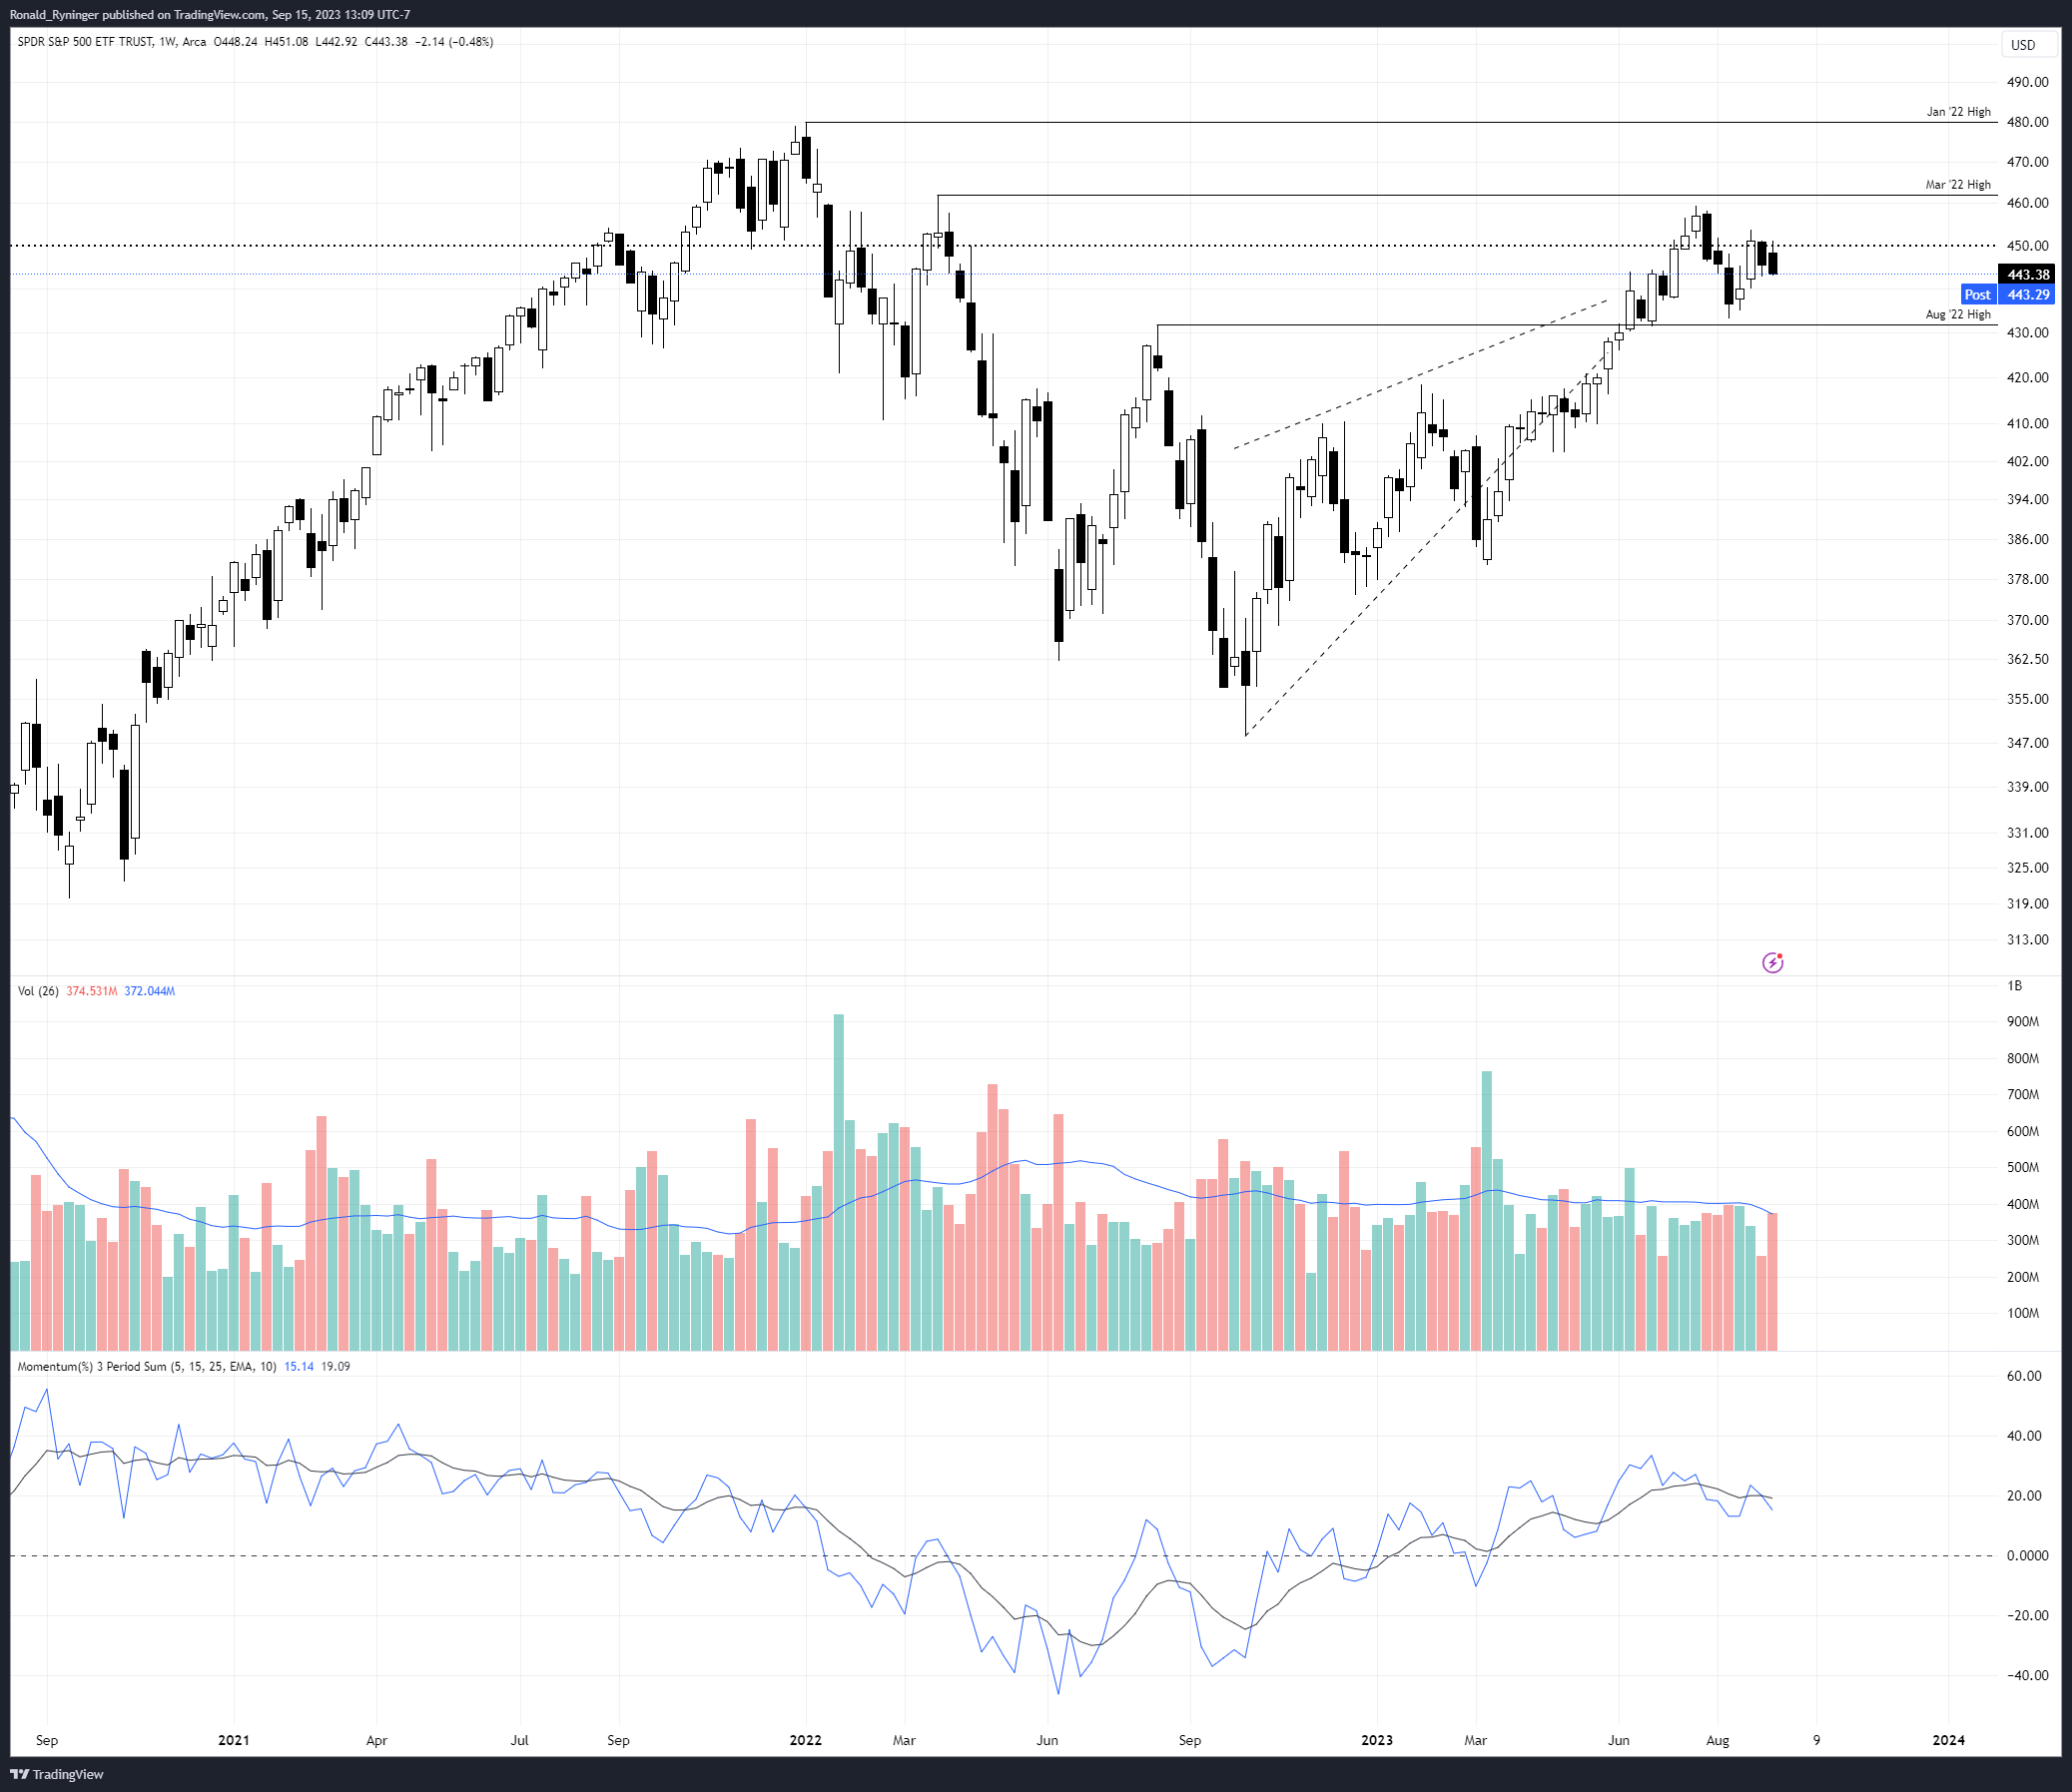
Daily price action reveals a weakness in the uptrend we have enjoyed this year. Today’s close brings us below the 21 and 50-day EMA, with the short-term MACD and RSI remaining near the respective centers.

It appears the catalyst the market is waiting for is next week’s Fed decision. The Fed meeting expectations and keeping the rates unchanged might provide the lift needed to see more positive returns this year. The Fed breaking expectations and raising rates could cause the market to push lower.
Education
Moving Average Envelopes
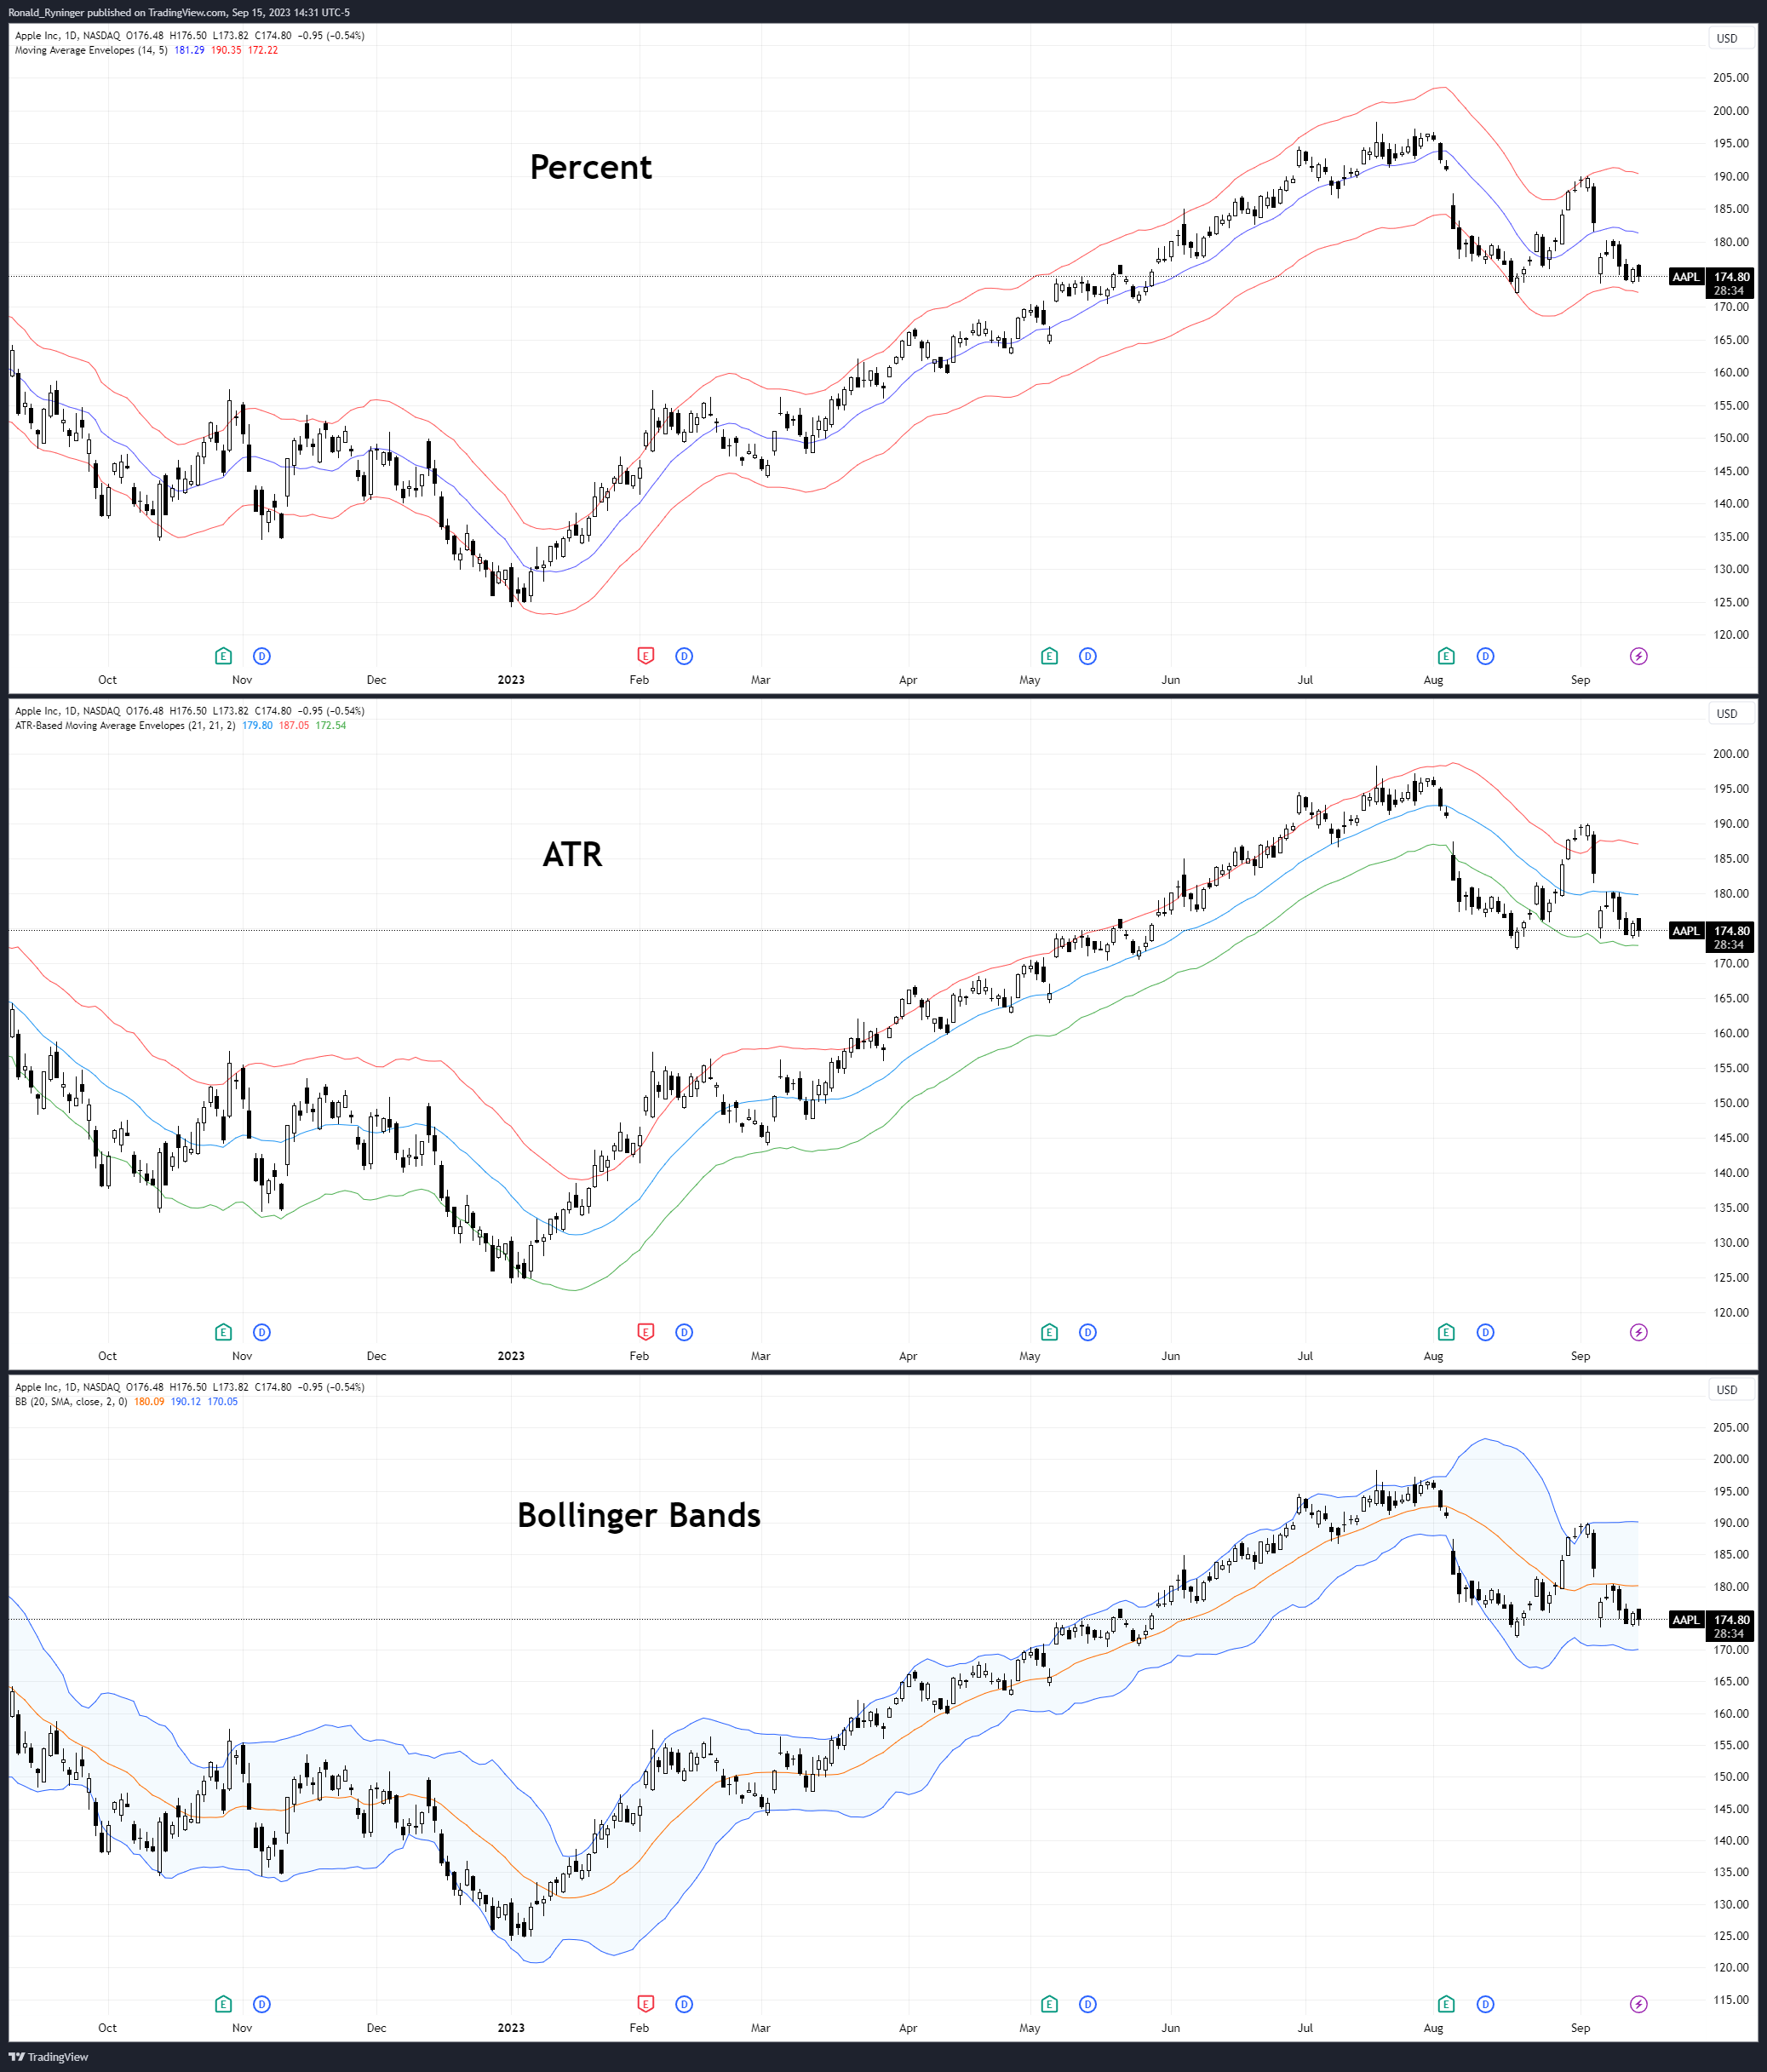
MA envelopes serve as filters around SMAs and EMAs. They display an upper and lower line around the moving average.
There are two popular ways to create these filters:
1. Percentage Method: Take the moving average and decide on a percentage, like 5%. For the top line, add 5% to the line's value. For the bottom line, subtract 5% from the line.
2. ATR Method: Instead of a fixed percentage, we use a value called the Average True Range (ATR). Add this ATR value to get the top line and subtract it for the bottom line. ATRs find the average price range over a specified period. Here is a link to learn more about them: Average True Range (ATR) Formula, What It Means, and How to Use It (investopedia.com)
Why use envelopes? They help us see clearer trends by identifying possible noise. A simple way to implement envelopes is to buy when prices move above the top band and sell when price goes below the bottom band.
A third type of envelope used frequently is the Bollinger Band, developed by John Bollinger. For Bollinger Bands, the upper and lower bands are calculated using the standard deviation. This allows the bands to adjust rapidly for changes in volatility. The standard setup is a moving average with a length of 20 and the bands two standard deviations above and below. Most strategies involving Bollinger Bands make entries and exits at the bands, the same as other envelope strategies. To learn more about Bollinger Bands, check out John Bollinger's website: https://www.bollingerbands.com/
Looking at the three envelope systems, it is apparent how sensitive Bollinger Bands are to volatility. Some traders prefer this responsiveness; others do not. Which indicator is used, if any at all, depends on the trader’s style and objective.