

Markets Showing Weakness

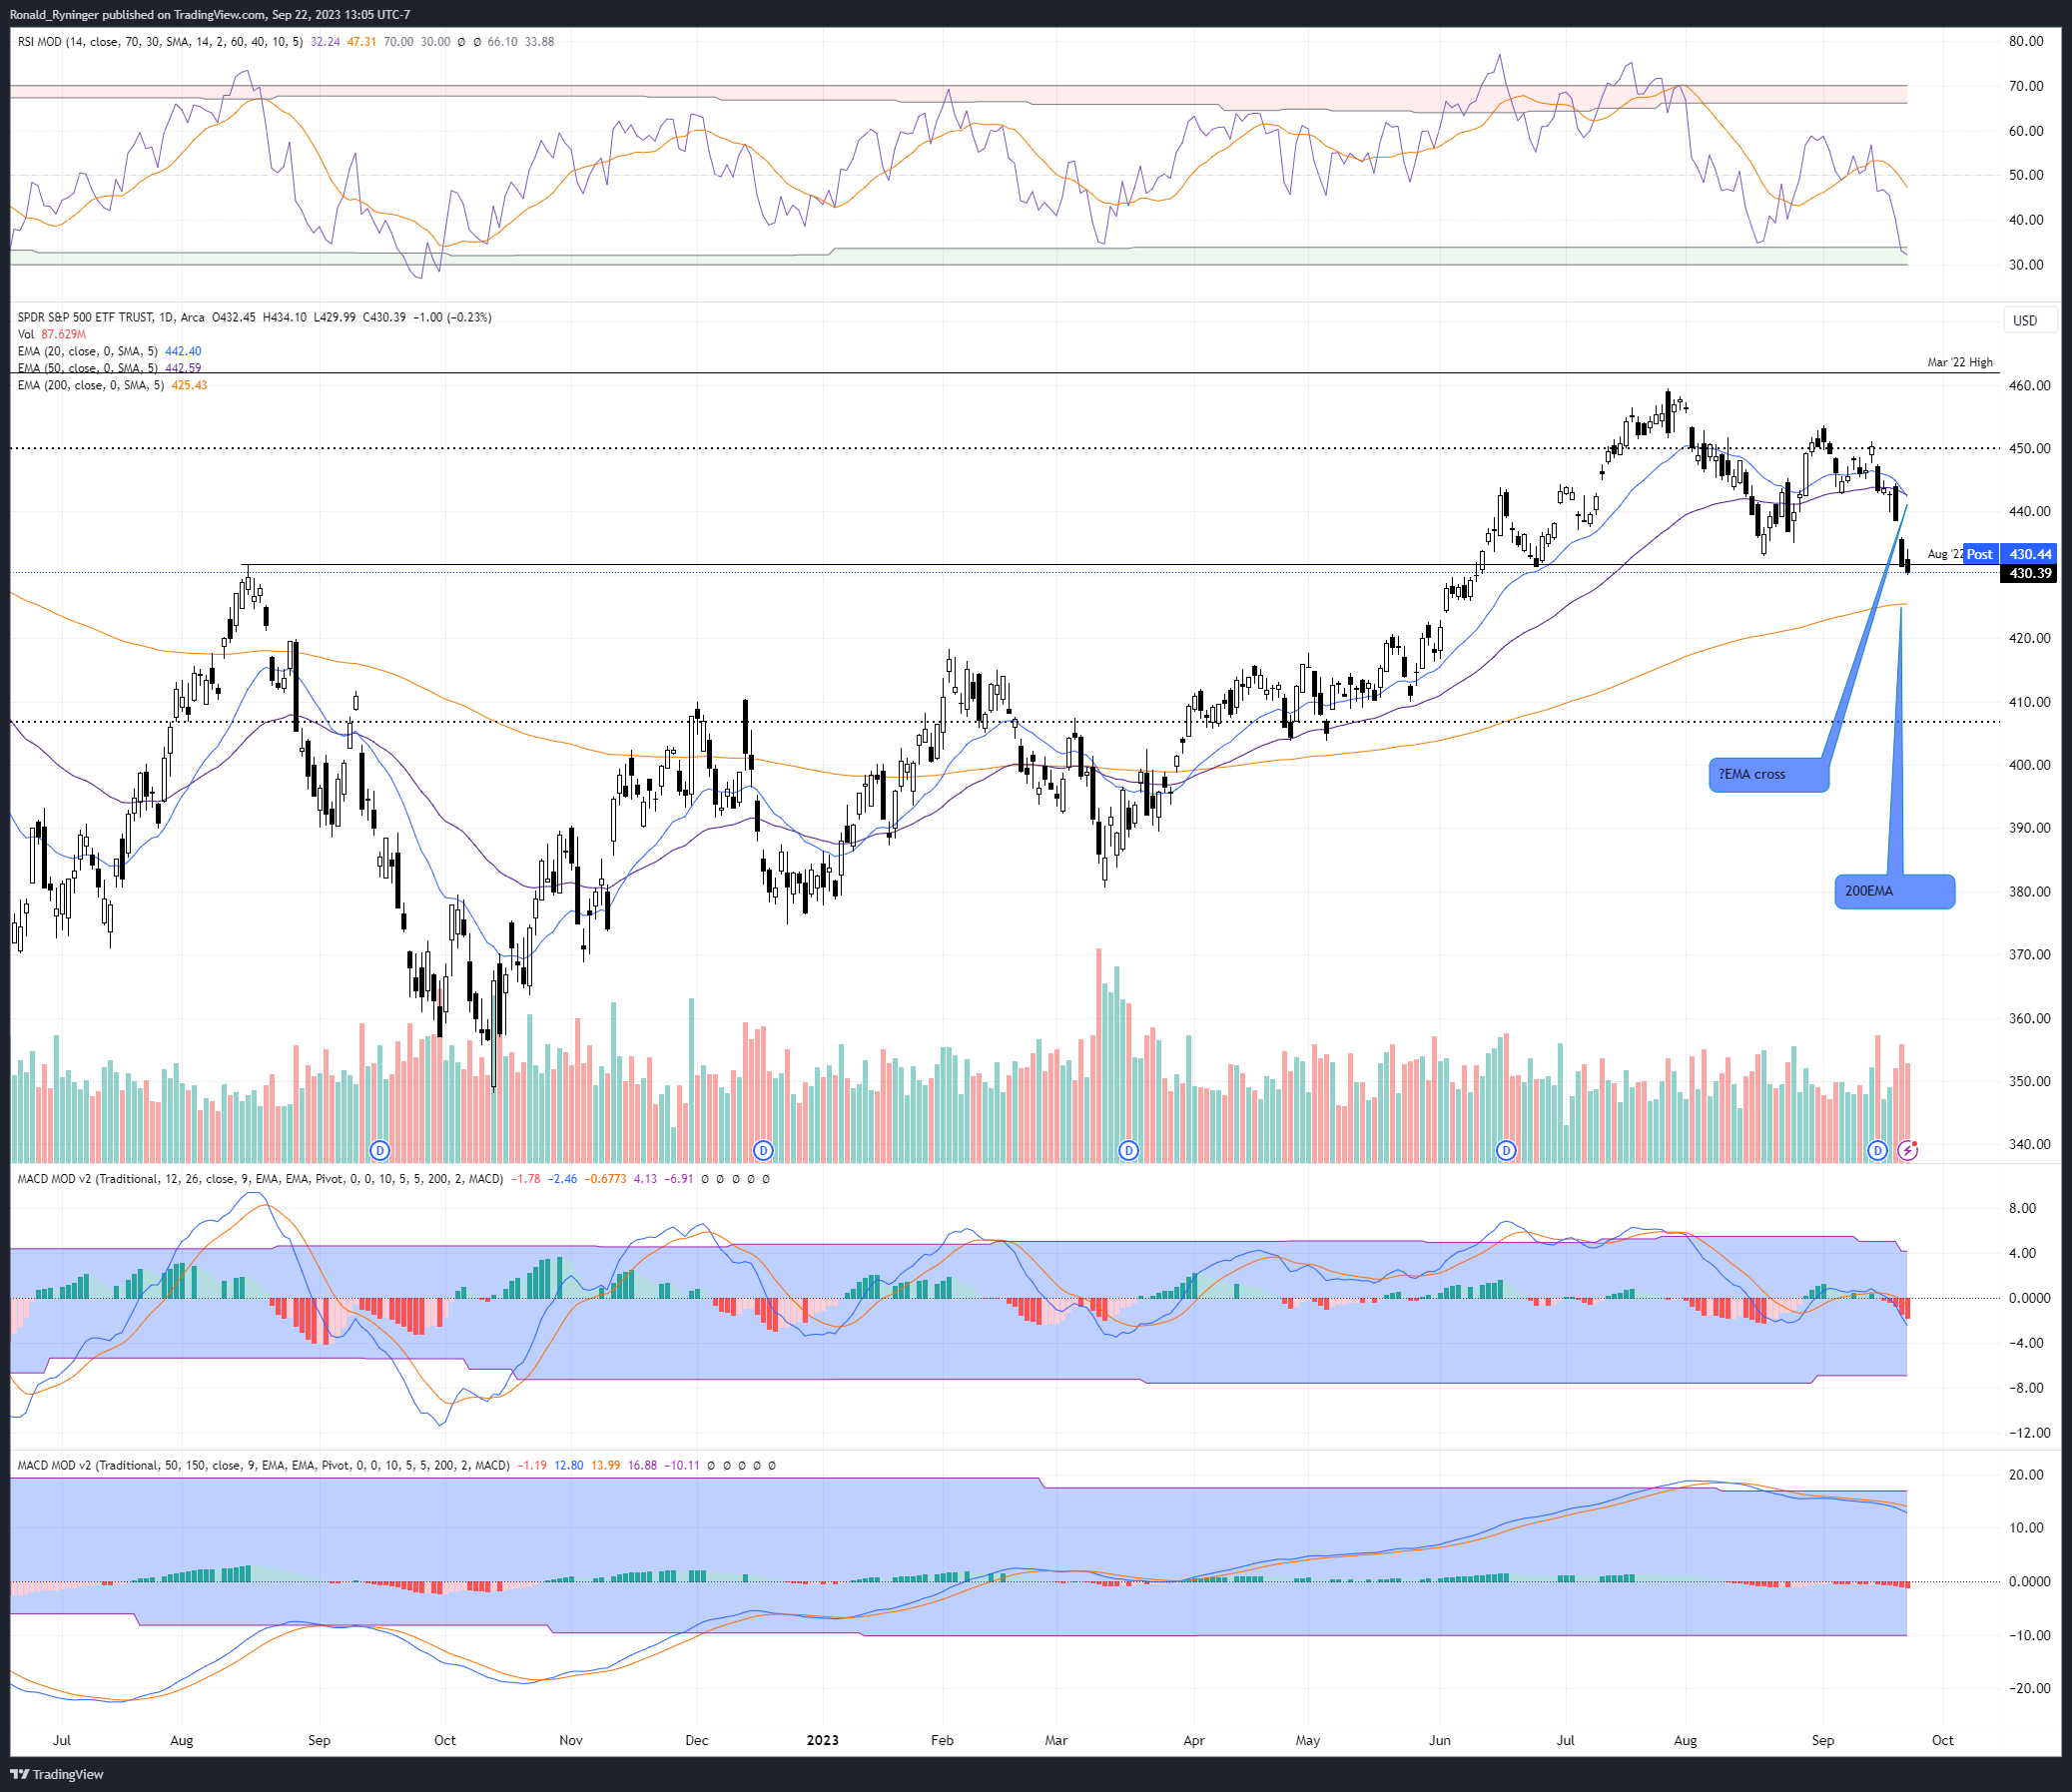
The Fed’s announcement of another possible rate hike this year and higher for longer seems to have helped the SP500 decide on a direction. On Wednesday, we saw the SPY break out to the downside of the range it has been stuck in. This break brought us down to the August 2022 high. It is too soon to tell whether it will find support there. It feels unlikely; I am watching for the SPY to decline to the 200EMA on the daily chart.
The daily chart shows that the 20EMA crossed below the 50EMA. We also see support for this selloff with increased volumes on the down days.
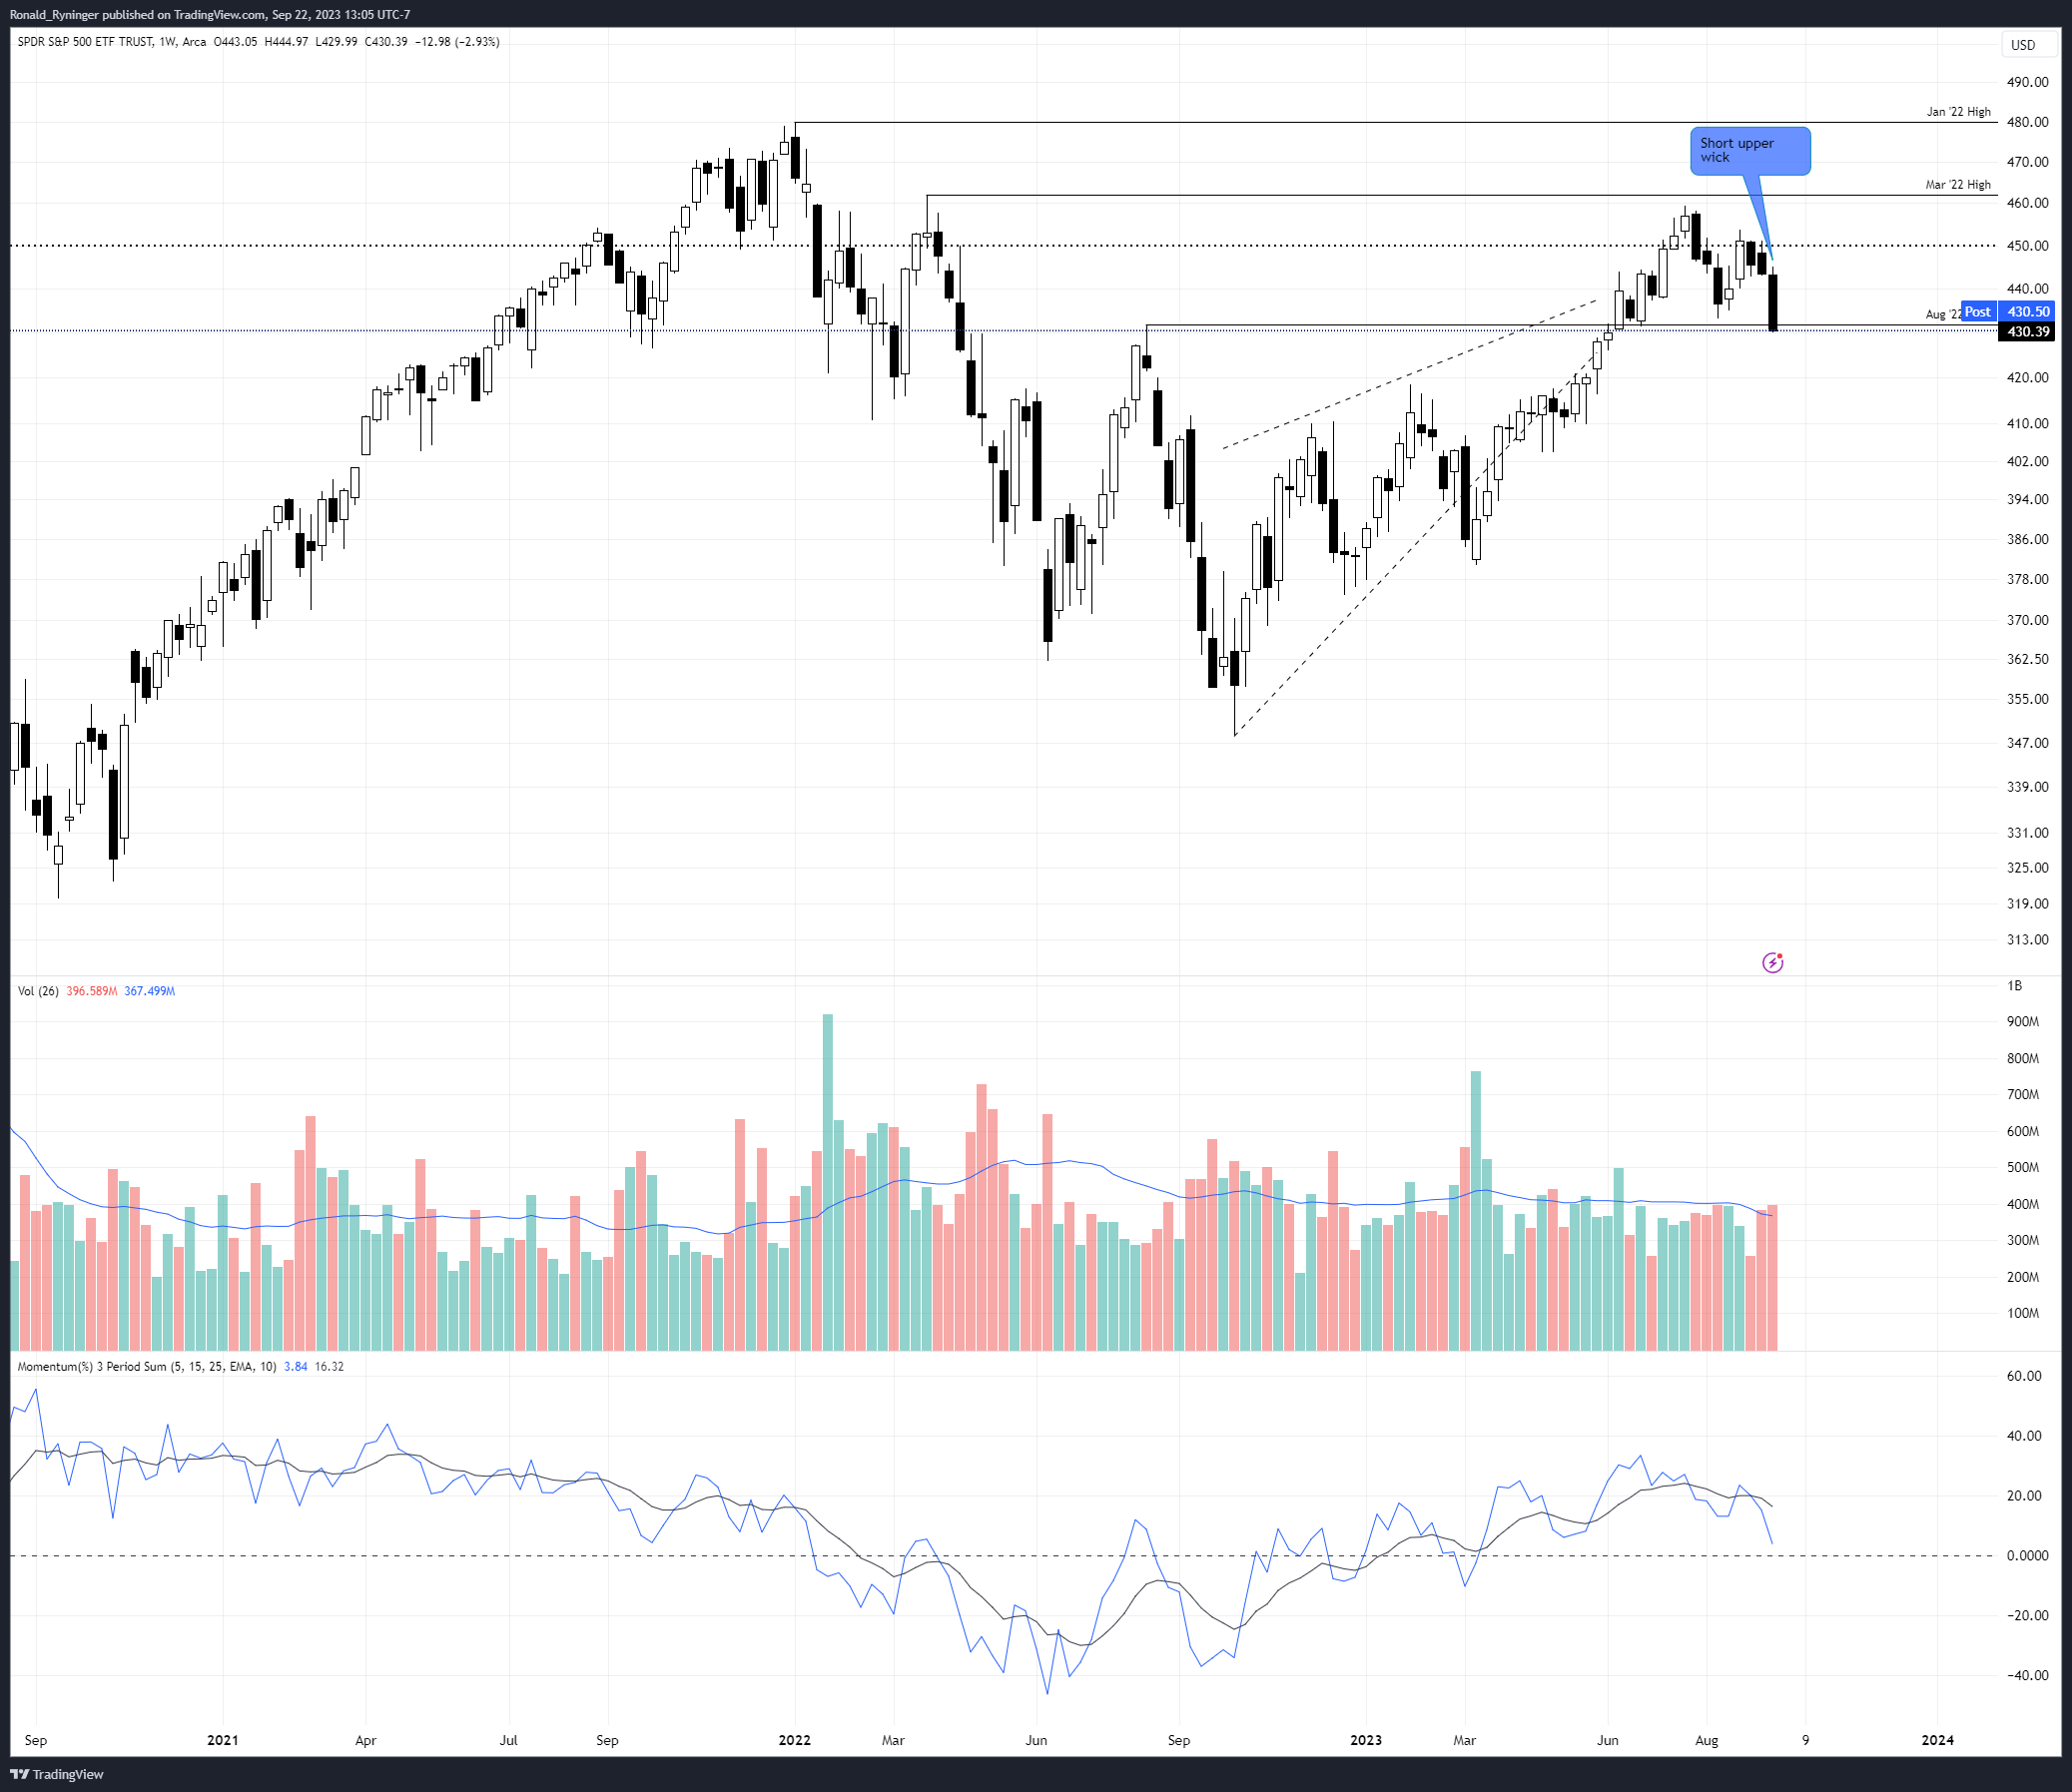
The weekly chart shows a large black candle with a small upper wick and volume above the 26-week average. This shows that sellers were in control this week.
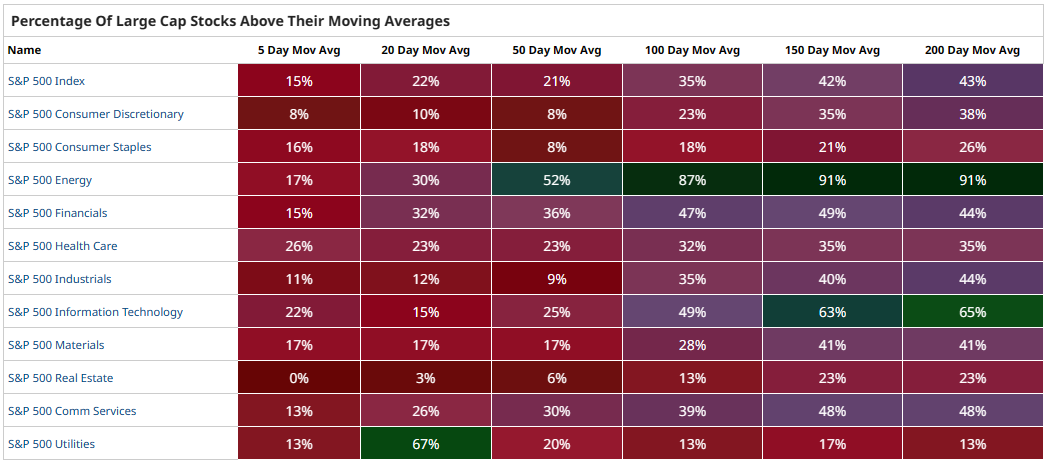
Breadth also took a beating this week. Energy is the last sector showing strength. During the 2022 correction, Energy proved to be a bright spot.
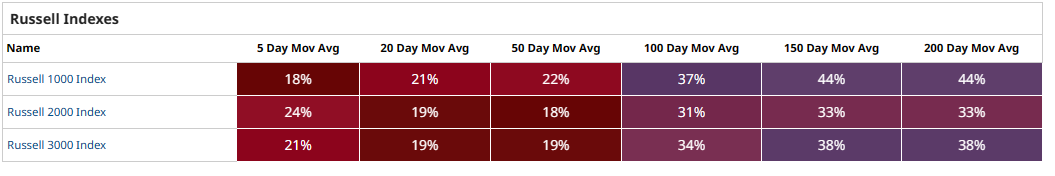
This weakness in breadth is also seen in the small-cap names that make up the Russell 2000.
Going into next week, I am watching for this correction to continue. My new positions will be limited, and I will be watching for exits in my current positions.
Hope everyone has a great weekend!