


S&P 500 Overview
The daily chart shows a strong opening to the week, followed by a decline into Friday. This decline brings the S&P 500 (SPY) close to last week's low. So what felt good the previous week feels painful this week.

The number of stocks within SPY with their 50-day EMA over their 200-day EMA continues to increase, with the low being on May 6th.

Sector Overview
This week, we saw weaker performance from the sectors, with Consumer Staples (XLP) and Healthcare (XLV) being the only two obtaining positive returns. Energy (XLE) struggled this week, falling almost 5%.

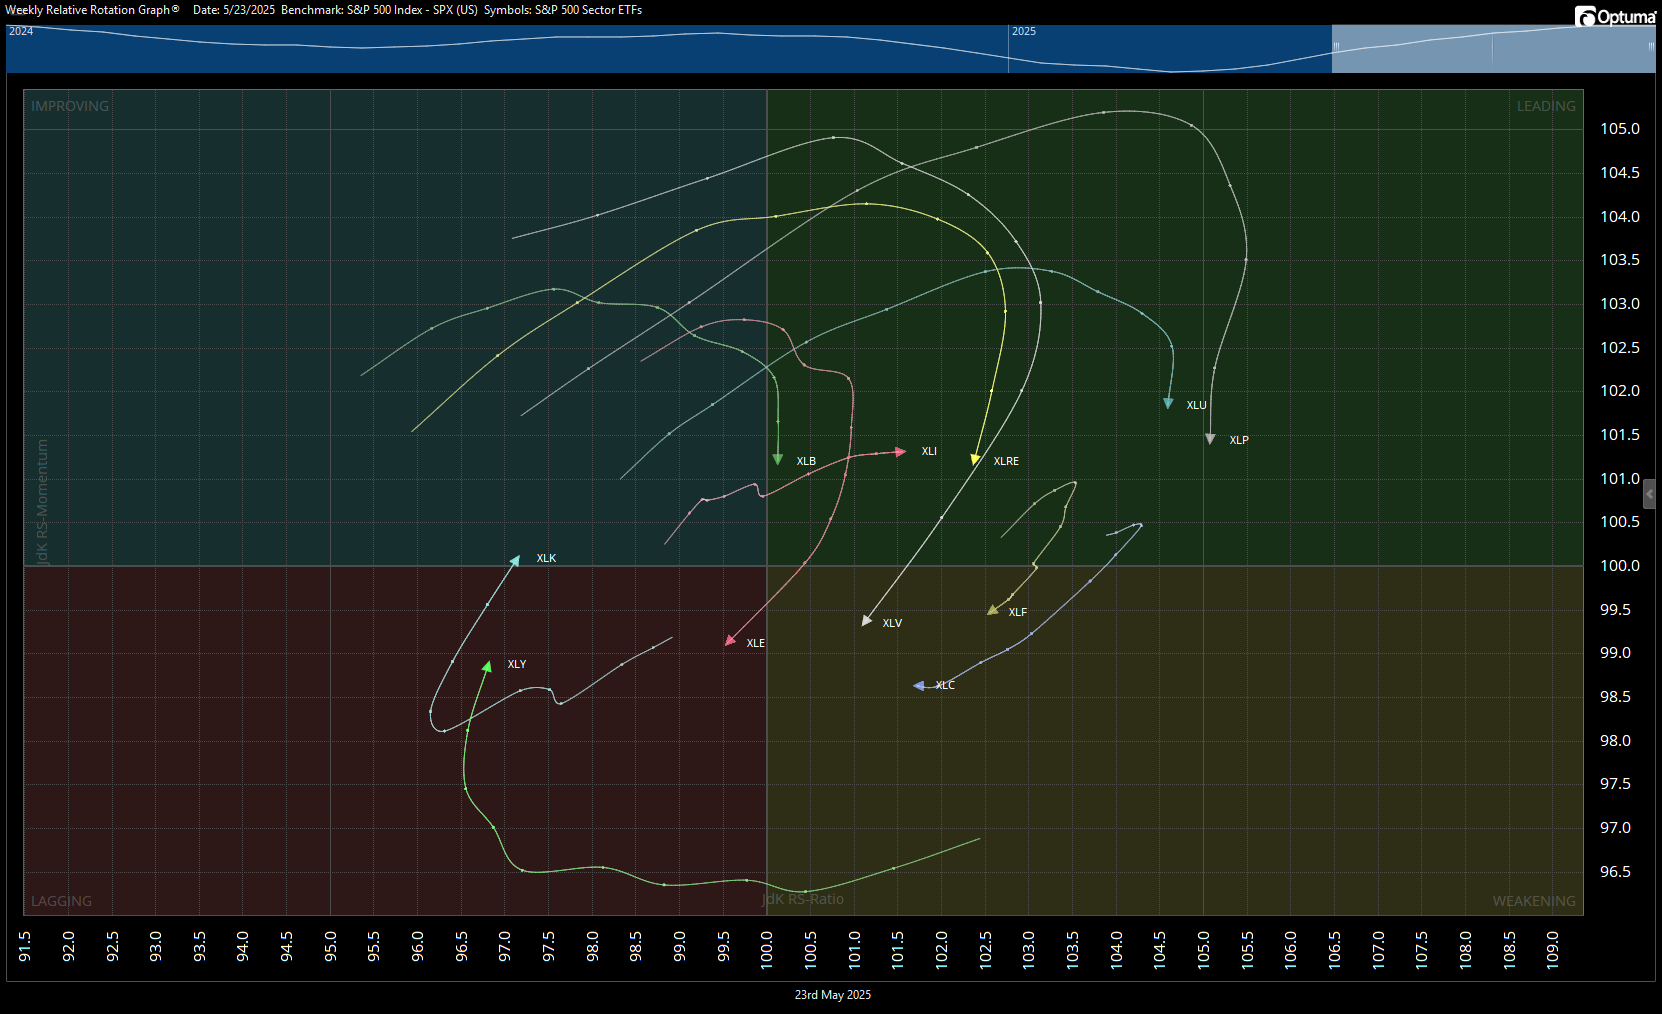
The weekly RRG chart shows all sectors except Industrials (XLI) on the path to exit the leading quadrant. XLI is also the top-performing sector year to date.
Short-term breadth mirrored what we saw this week in the market—red. Long-term breadth held on to strength in sectors such as XLI, XLC, and XLU, which have shown strength this year.

Disclaimer: Content is provided for informational purposes only and is not a recommendation to buy or sell any security. Please do your own research before making investment decisions. All information is from personal research unless otherwise noted. Best efforts are made to ensure that all information is accurate, but unintended errors and misprints may occur. I may own positions in the securities discussed.