

Fed Week Snaps Losing Streak
Fed Week Snaps Losing Streak
Week of 10/29/2023

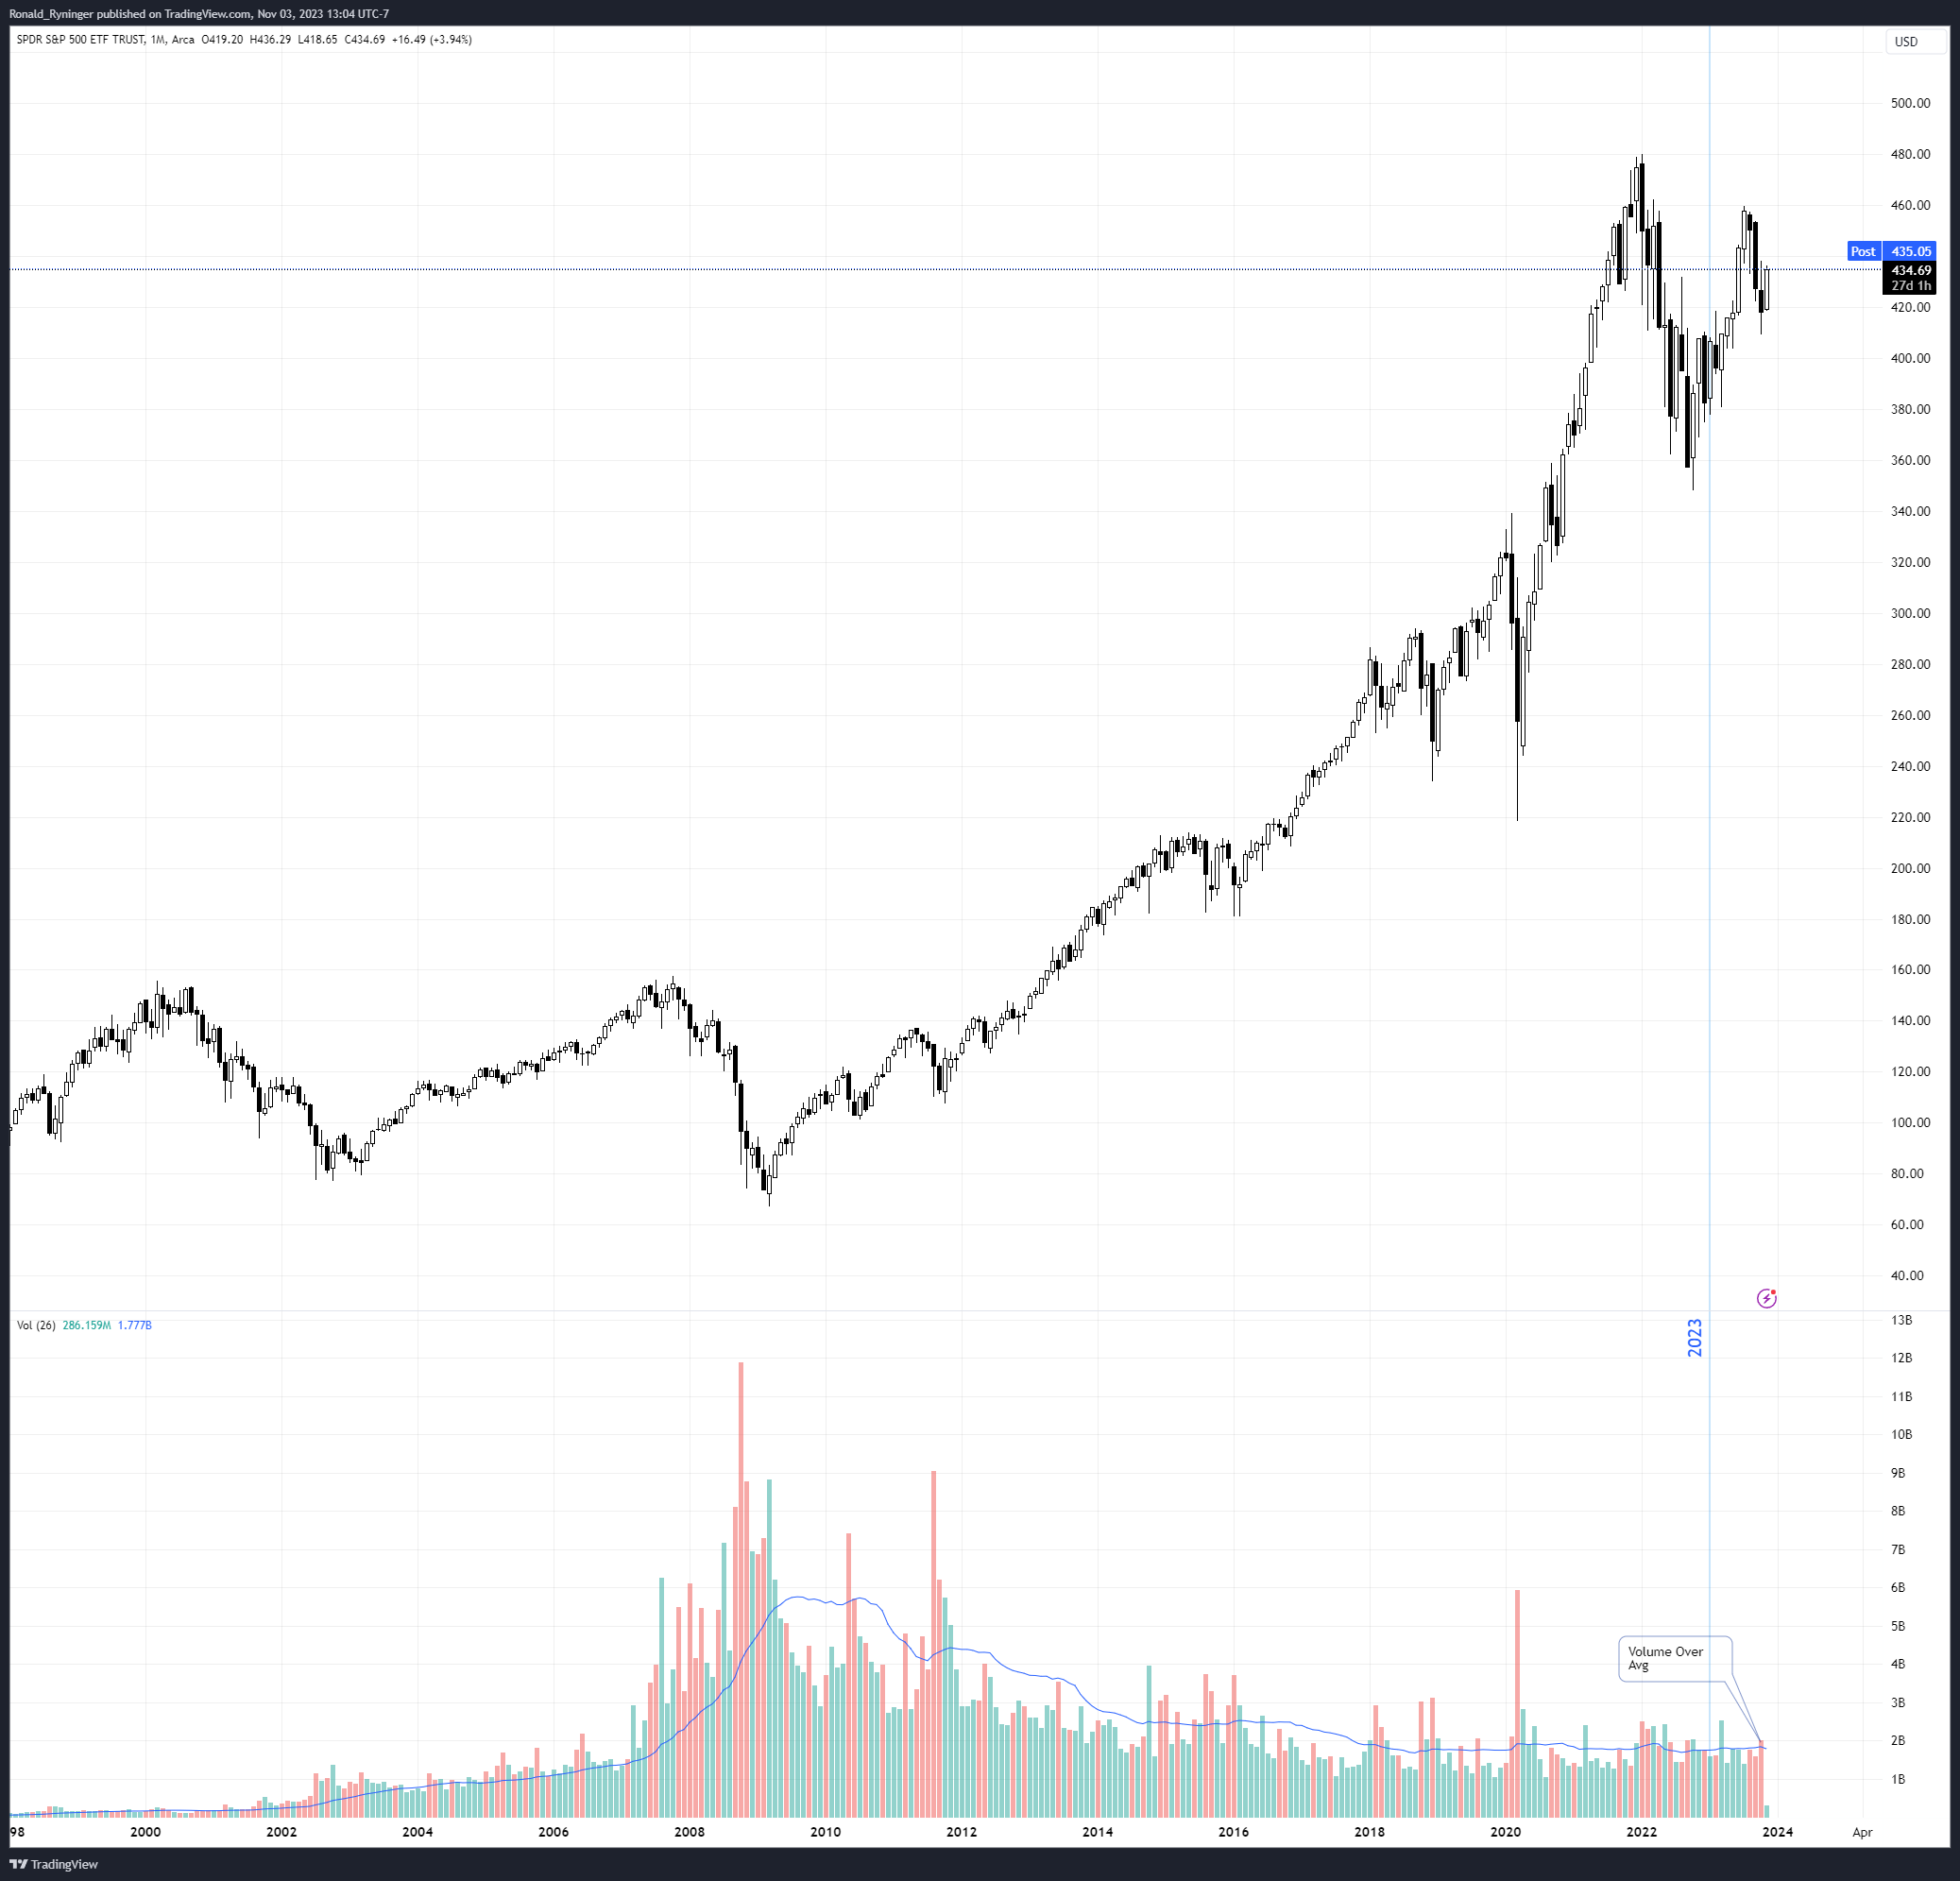
This snaps the two-week losing streak that October ended on. SPY ends the first trading sessions of November over the August 2022 high. At the end of the month, it is always helpful to zoom out and look at a monthly chart (each candle represents one month of trading) to get a better feel of what occurred. There was a lot of negative sentiment in the last two weeks of October, but looking at the monthly chart, October shows as indecisive. The close and open are centered between wicks for the high and low. Signaling indecision and that neither the bulls nor bears were in control.
Traditionally, the last two months of the year are strong. If the price this month is able to cross October’s high without going below its low, there is a big chance we will see another substantial rally into year-end.
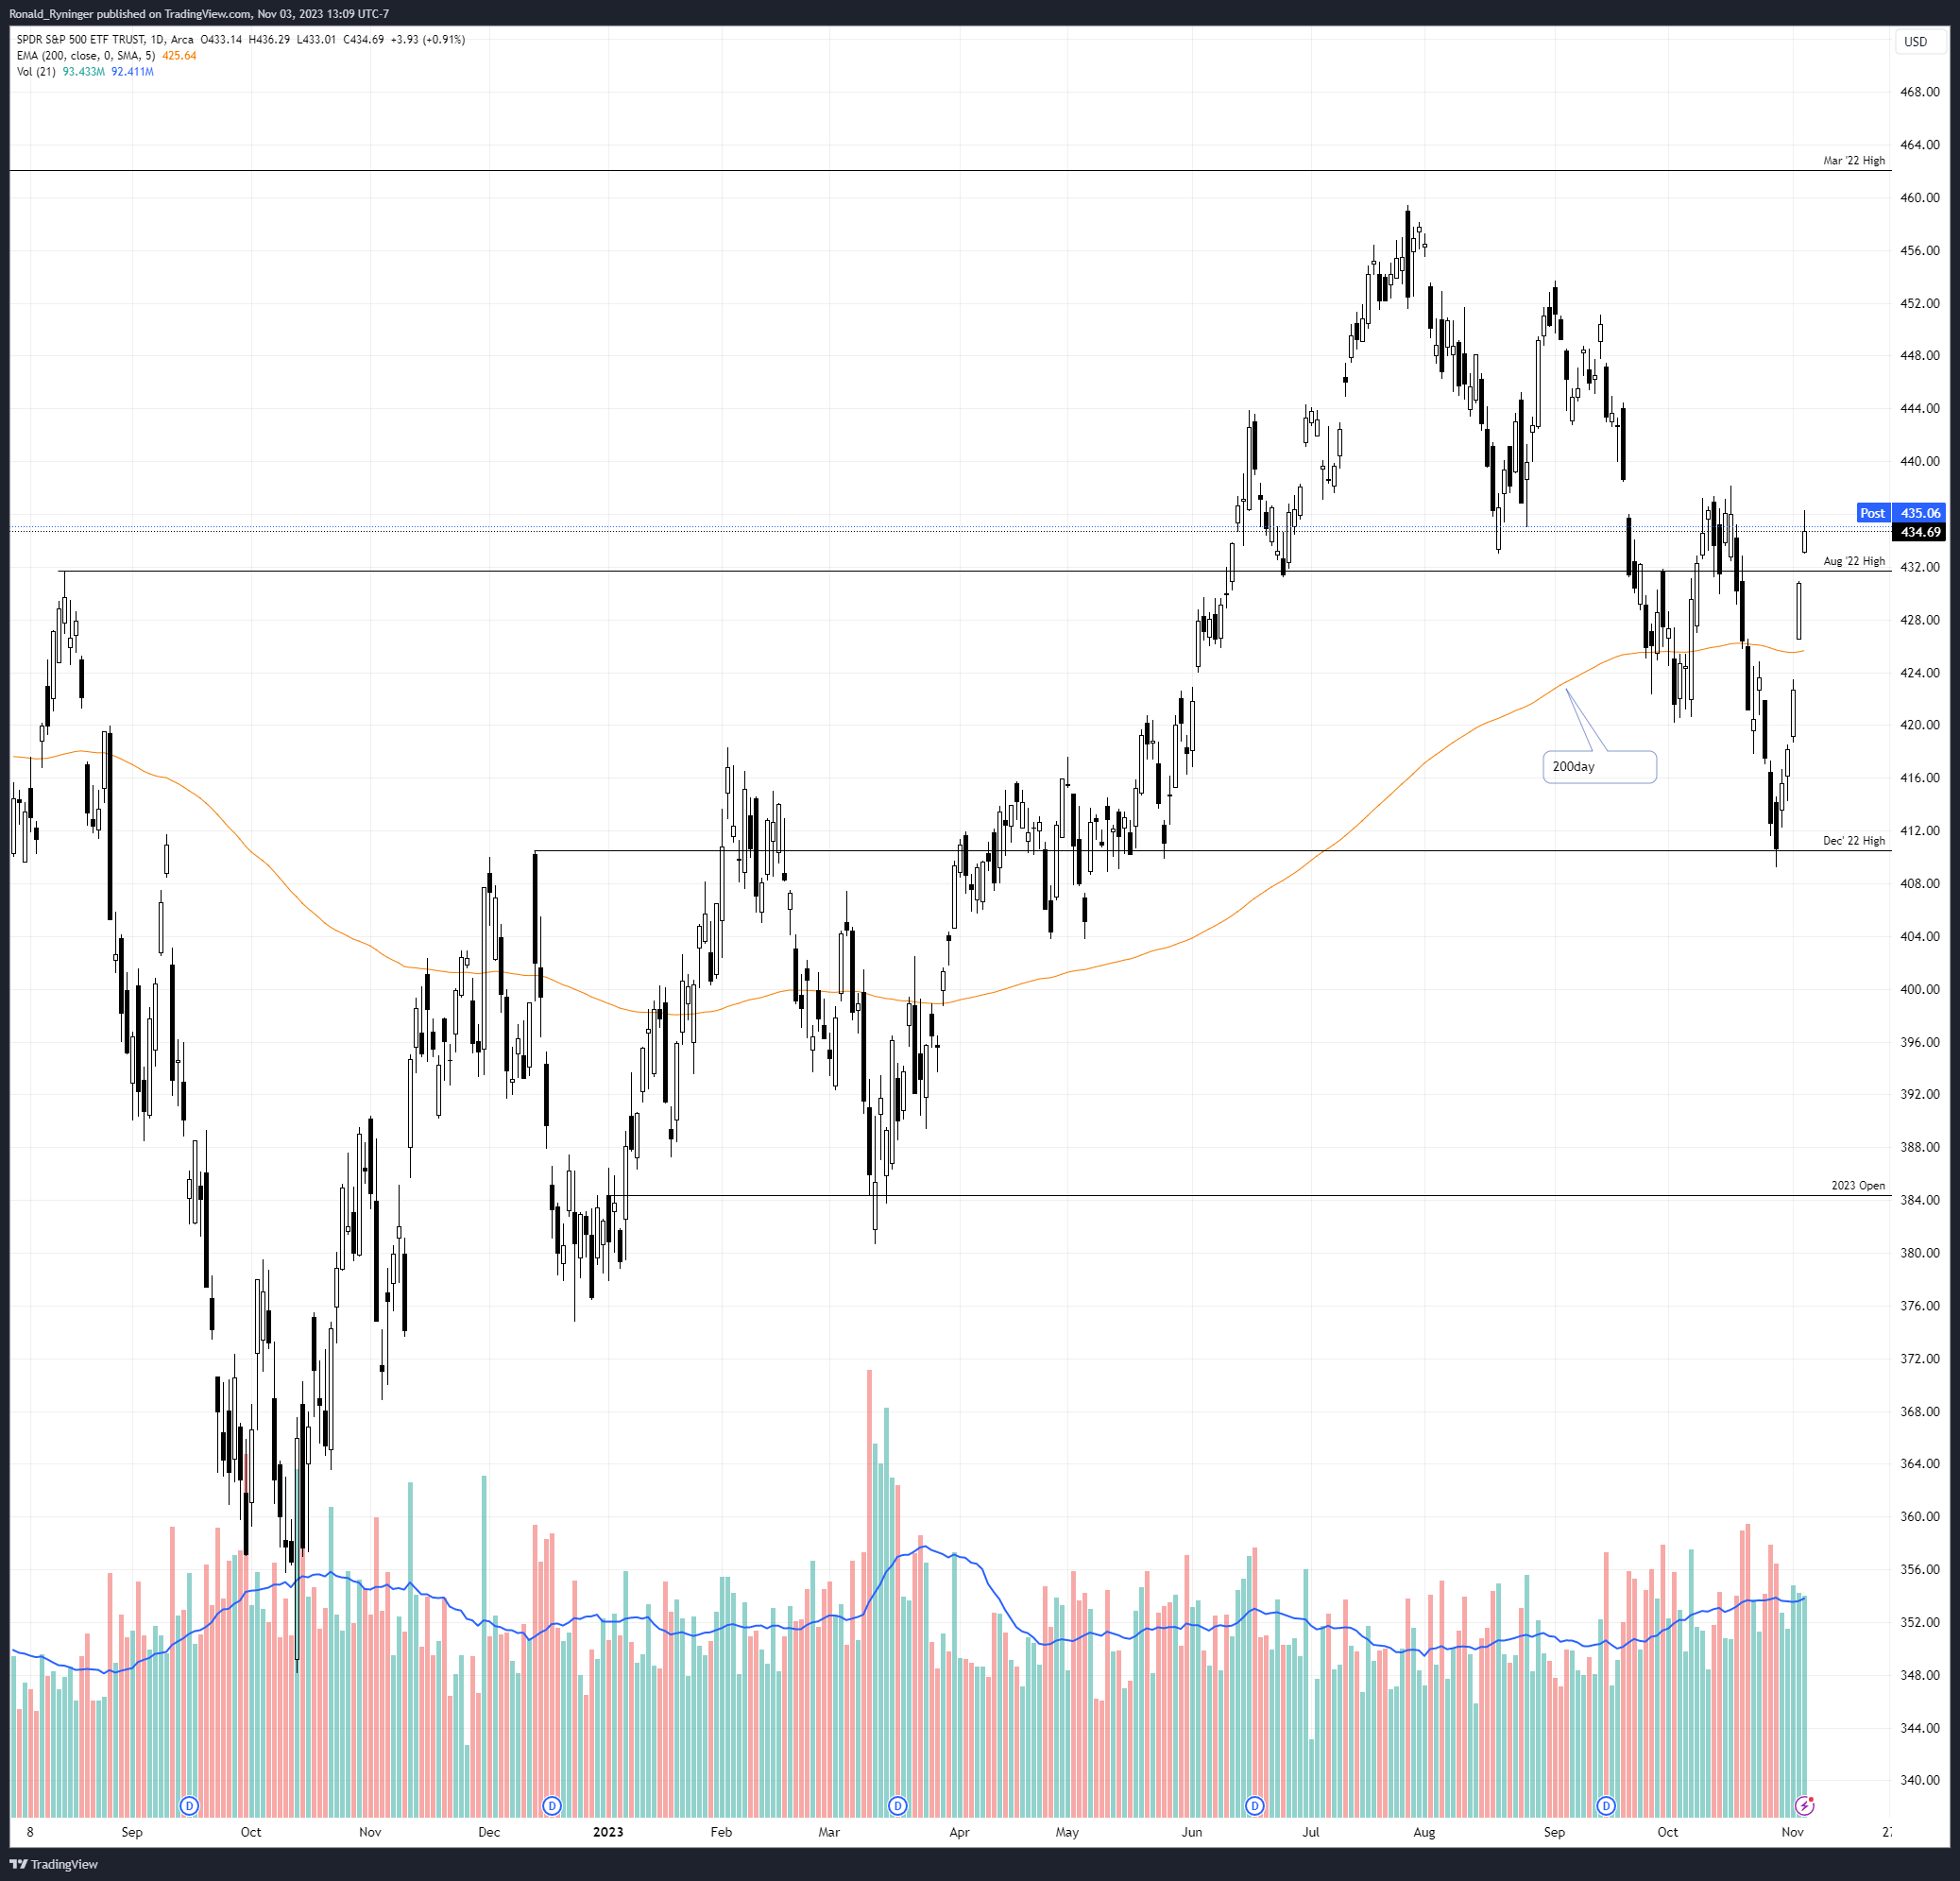
On the daily time frame, the price retook the 200-day moving average and remained above it.
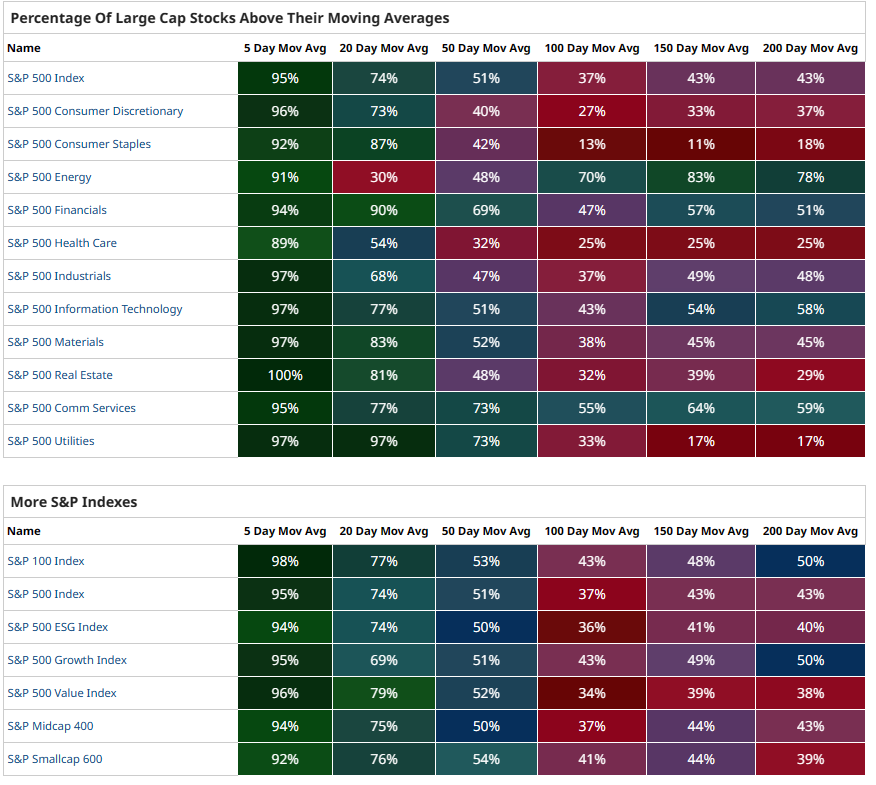
Across the SP500, we saw an increase in breadth.
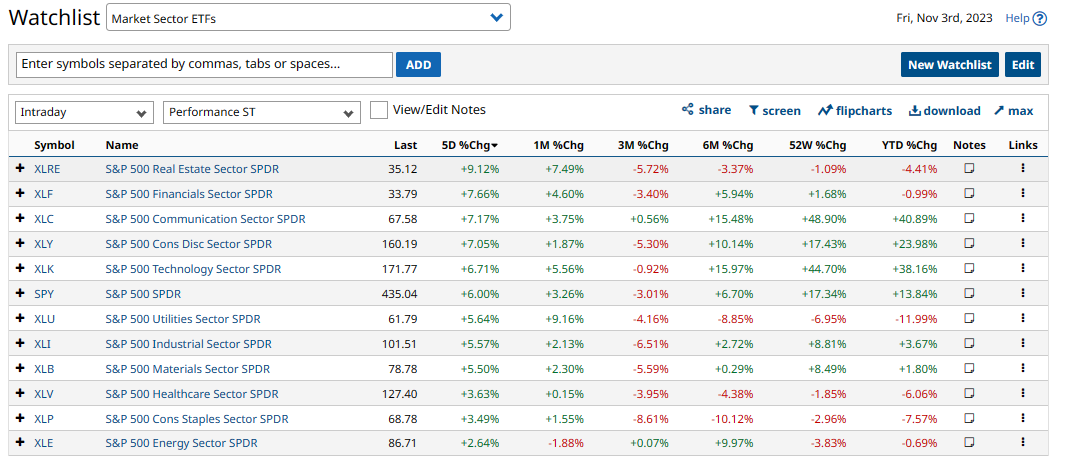
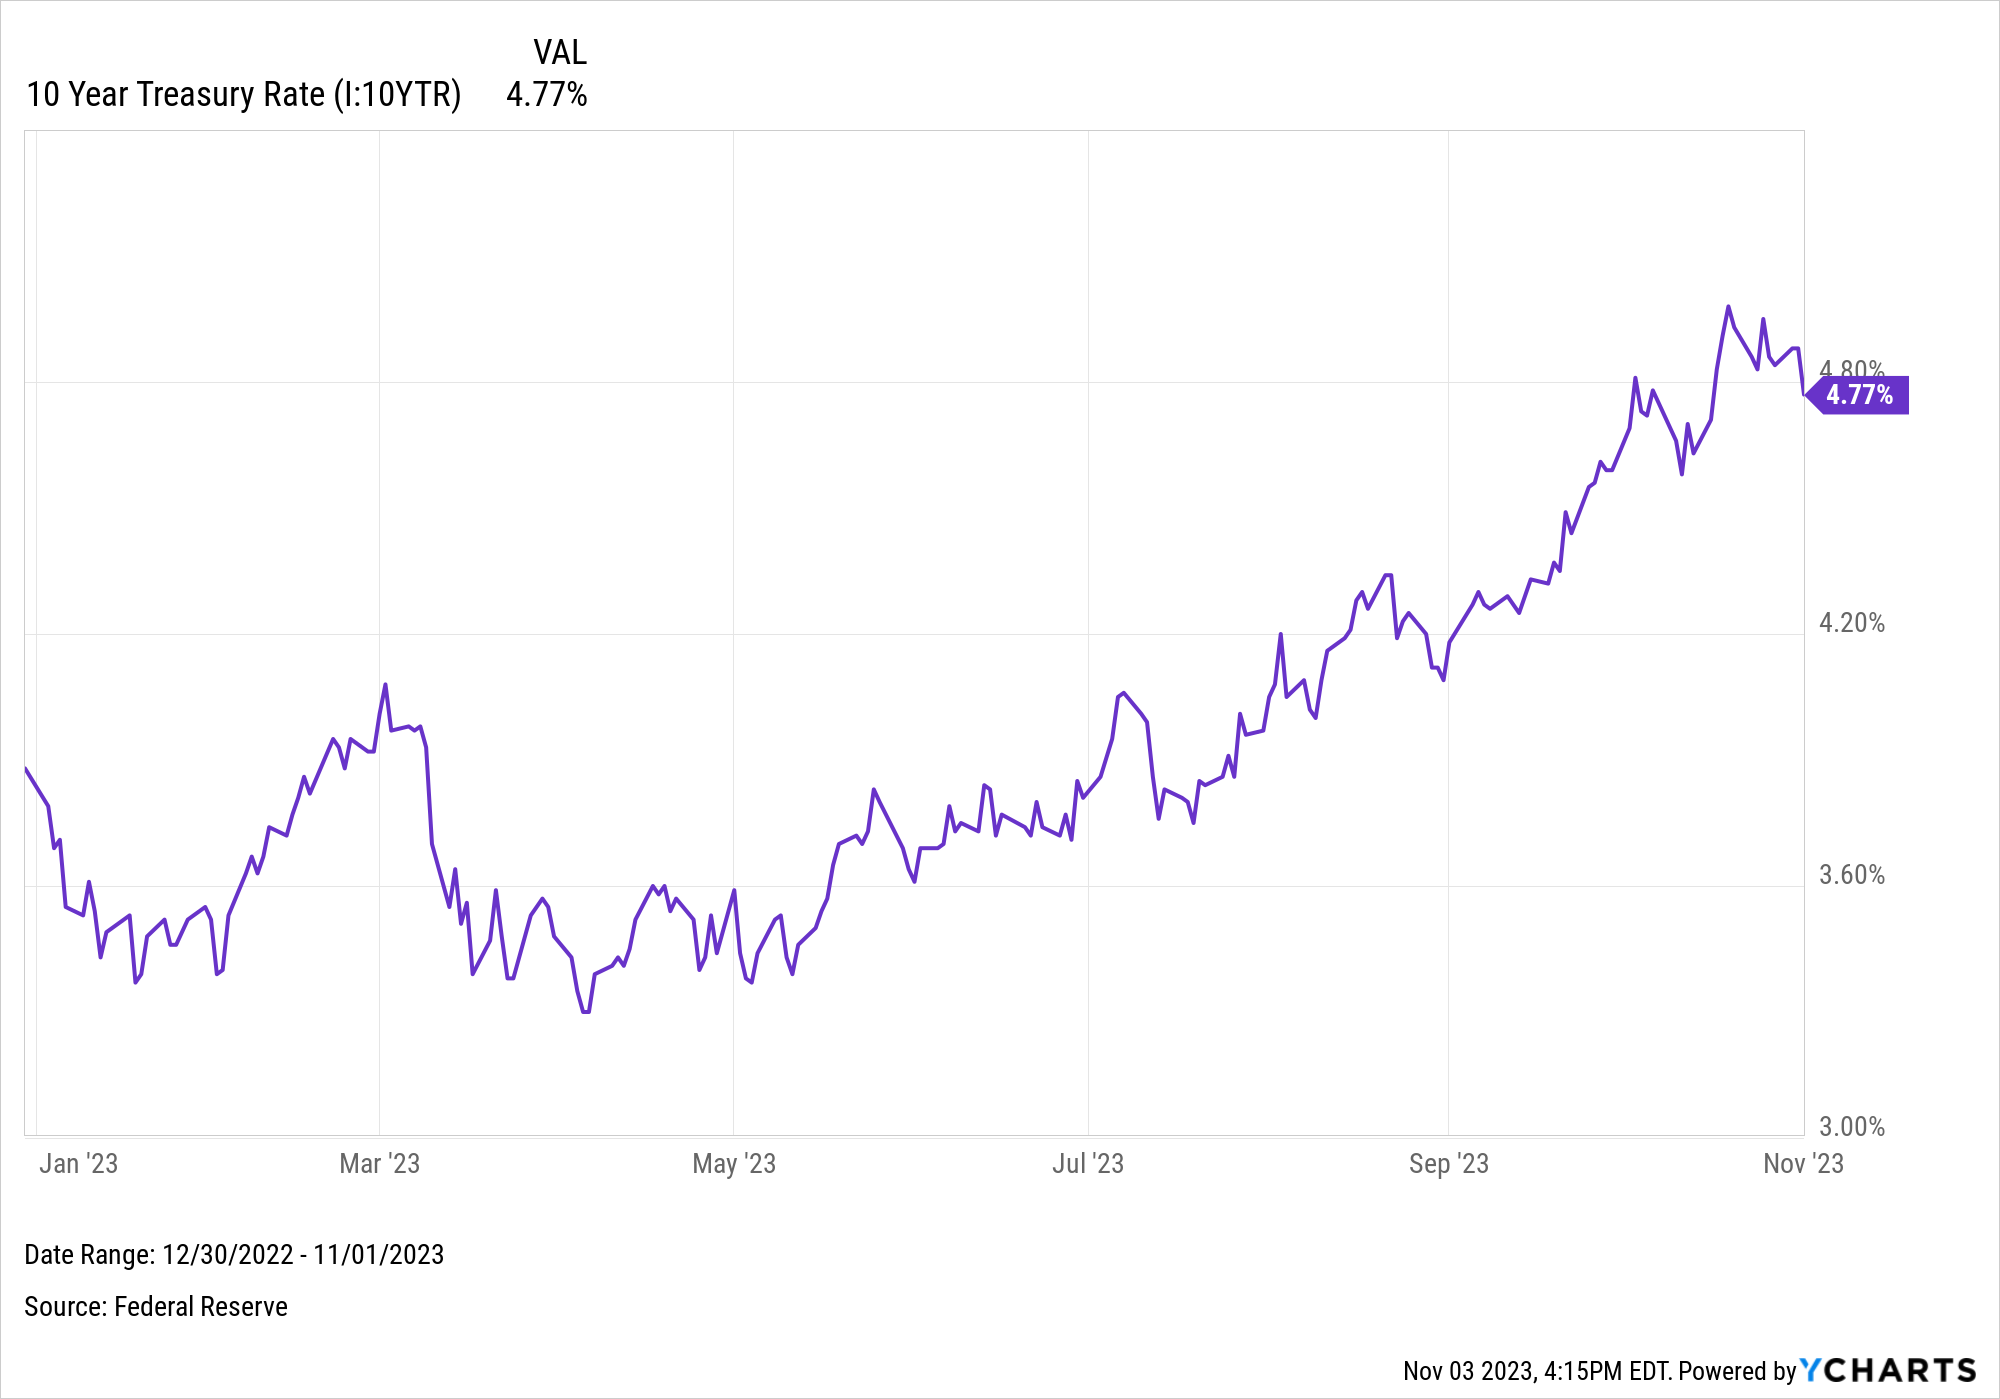
Real Estate led the sectors this week, spurred by decreased Treasury rates.
This uptick in the market should provide some opportunities to enter equities before the year’s end.
I hope everyone has a great weekend!
Real Money Trading Journal